
Fig. 1
- ID
- ZDB-FIG-231018-1
- Publication
- Hu et al., 2023 - Single-cell transcriptome profiling reveals diverse immune cell populations and their responses to viral infection in the spleen of zebrafish
- Other Figures
- All Figure Page
- Back to All Figure Page
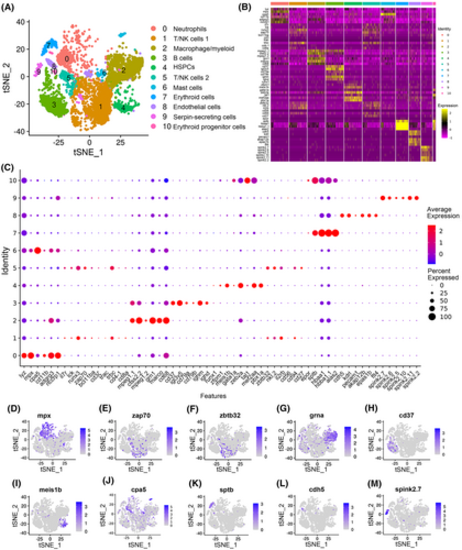
Categorization of the main immune cell types in zebrafish spleen. (A) tSNE nonlinear clustering was used to visualize the classification of the populations of zebrafish splenic leukocytes. PCA was performed after expression data were normalized. Dimension reduction was performed through PCA to reduce variables. Then, the clustering algorithm based on graph theory was used to cluster cells. (B) Heatmap of marker genes from each cluster. Each column in the figure represents a cell subtype, and each row represents a gene. The expression levels of genes in different cells are indicated by different colors. An intensely yellow color indicates high expression, and an intensely purple indicates low expression. (C) Dot plots showing the expression levels of marker genes and the percentages of cells per cluster that express the selected gene. (D–M) tSNE results of the molecular markers of the 10 immune cell types. The title of each subimage is the name of the marker gene. Each dot in the figure represents a cell, and dark dots indicate the high expression of the marker gene in a specific cell. Neutrophil marker gene in (D), T-cell marker gene in (E), NK-cell marker gene in (F), macrophage/myeloid cell marker gene in (G), B-cell marker gene in (H), HSPC marker gene in (I), mast cell marker gene in (J), erythroid cell marker gene in (K), endothelial cell marker gene in (L), and serpin-secreting cell marker genes in (M). |