
Fig. 14
- ID
- ZDB-FIG-231018-14
- Publication
- Hu et al., 2023 - Single-cell transcriptome profiling reveals diverse immune cell populations and their responses to viral infection in the spleen of zebrafish
- Other Figures
- All Figure Page
- Back to All Figure Page
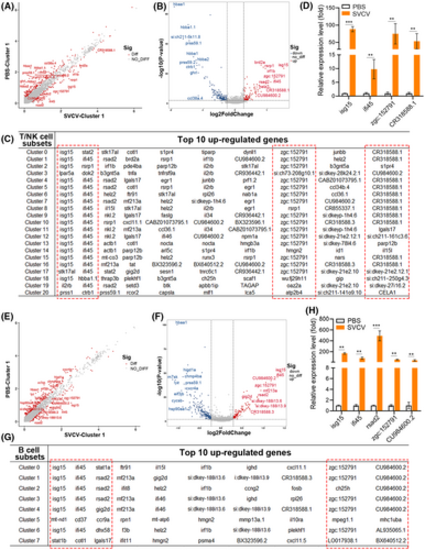
Analysis of key virus-responsive genes beyond IFN genes in T/NK and B-cell subtypes upon SVCV infection. (A, B) Scatter plot (A) and volcano plot (B) of DEGs that were selectively examined in cluster 1 T-cell subtypes between the control and SVCV-infected groups. (C) Top 10 up-regulated genes in each cluster of T/NK cells. The red dashed box indicates the significantly up-regulated genes in almost each subtype of T/NK cells upon SVCV infection. (D) Selective RT-qPCR examination of four key virus-responsive genes (isg15, ifi45, zgc:152791, and CR318588.1) in T/NK cells upon SVCV stimulation. (E, F) Scatter plot (E) and volcano plot (F) of selectively examined DEGs in cluster 1 B-cell subtypes between the control and SVCV-infected groups. (G) Top 10 up-regulated genes in each cluster of B cells. The red dashed box indicates the significantly up-regulated genes in almost each subtype of B cells upon SVCV infection. (H) Selective RT-qPCR examination of five key virus-responsive genes (isg15, ifi45, rsad2, zgc:152791, and CU984600.2) in B cells upon SVCV stimulation. Error bars represent SD. All data were obtained from at least three independent experiments. **p < .01, ***p < .001. |