
FIGURE
Fig. 8.
- ID
- ZDB-FIG-221226-128
- Publication
- Do et al., 2022 - Hypoxia deactivates epigenetic feedbacks via enzyme-derived clicking proteolysis-targeting chimeras
- Other Figures
- All Figure Page
- Back to All Figure Page
Fig. 8.
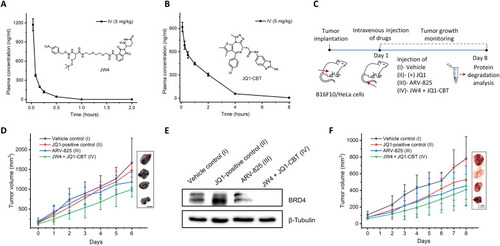
Pharmacokinetic analysis and tumor inhibition studies of ENCTACs. (A and B) Plasma concentration–time profiles of JW4 (A) and JQ1-CBT (X = NH) (B) after intravenous dosing (5 mg/kg). (C) Schematic diagram for the treatment of ENCTACs in the xenograft mouse model with melanoma and HeLa tumor. (D) Representative images and quantitative analysis of tumor volume (means ± SD) of melanoma mice treated with vehicle (n = 4), JQ1 (5 mg/kg, n = 5), ARV-825 (5 mg/kg; n = 5), or JW4 + JQ1-CBT mixture (5 mg/kg; n = 5) for 6 days. (E) Western blot analysis of BRD4 levels in melanoma tumor after intravenous injection of vehicle, JQ1, ARV-825, or JW4 + JQ1-CBT (5 mg/kg). (F) Representative images and quantitative analysis of tumor volume (means ± SD) of HeLa tumor–bearing mice treated with vehicle control (n = 3), JQ1 (5 mg/kg, n = 3), ARV- 825 (5 mg/kg; n = 3), or JW4 + JQ1-CBT mixture (5 mg/kg; n = 3) for 8 days.
|
Expression Data
Expression Detail
Antibody Labeling
Phenotype Data
Phenotype Detail
Acknowledgments
This image is the copyrighted work of the attributed author or publisher, and
ZFIN has permission only to display this image to its users.
Additional permissions should be obtained from the applicable author or publisher of the image.
Full text @ Sci Adv