IMAGE

Fig. 8.

ID
ZDB-IMAGE-221226-135
Source
Figures for Do et al., 2022
Image
Figure Caption

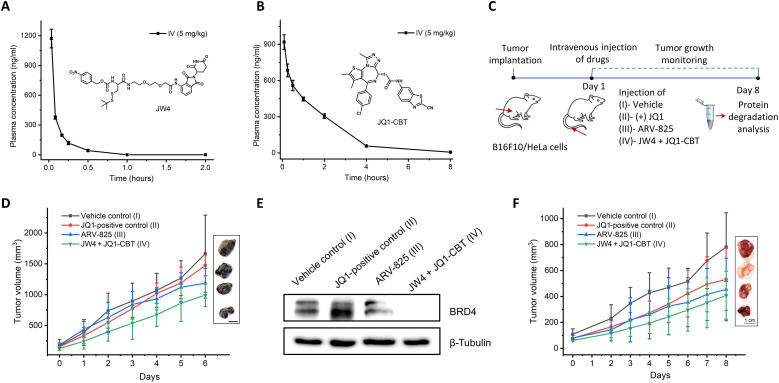
Fig. 8. Pharmacokinetic analysis and tumor inhibition studies of ENCTACs.

(A and B) Plasma concentration–time profiles of JW4 (A) and JQ1-CBT (X = NH) (B) after intravenous dosing (5 mg/kg). (C) Schematic diagram for the treatment of ENCTACs in the xenograft mouse model with melanoma and HeLa tumor. (D) Representative images and quantitative analysis of tumor volume (means ± SD) of melanoma mice treated with vehicle (n = 4), JQ1 (5 mg/kg, n = 5), ARV-825 (5 mg/kg; n = 5), or JW4 + JQ1-CBT mixture (5 mg/kg; n = 5) for 6 days. (E) Western blot analysis of BRD4 levels in melanoma tumor after intravenous injection of vehicle, JQ1, ARV-825, or JW4 + JQ1-CBT (5 mg/kg). (F) Representative images and quantitative analysis of tumor volume (means ± SD) of HeLa tumor–bearing mice treated with vehicle control (n = 3), JQ1 (5 mg/kg, n = 3), ARV- 825 (5 mg/kg; n = 3), or JW4 + JQ1-CBT mixture (5 mg/kg; n = 3) for 8 days.

Acknowledgments
This image is the copyrighted work of the attributed author or publisher, and ZFIN has permission only to display this image to its users. Additional permissions should be obtained from the applicable author or publisher of the image. Full text @ Sci Adv