FIGURE

Figure 11

ID
ZDB-FIG-211216-157
Publication
Dalum et al., 2021 - High-Resolution, 3D Imaging of the Zebrafish Gill-Associated Lymphoid Tissue (GIALT) Reveals a Novel Lymphoid Structure, the Amphibranchial Lymphoid Tissue
Other Figures
All Figure Page
Back to All Figure Page
Figure 11

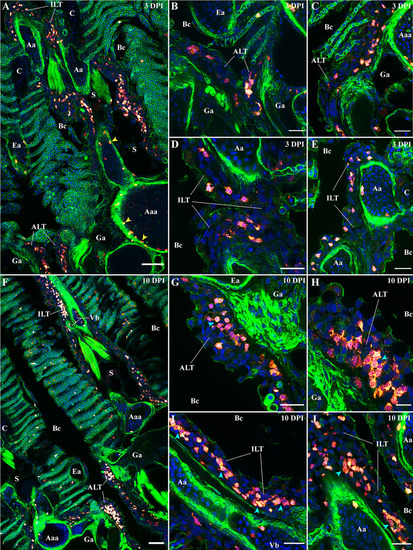
Modifications of the zf-GIALT structure upon SVCV infection. Representative deconvolved confocal images of adult zebrafish gills 3 days (A–E) and 10 days (F–J) post-infection with the Spring Viraemia of Carp Virus (SVCV). Images were acquired from 30 μm whole-body cryosections stained with phalloidin (green) and DAPI (blue) and where T/NK cells were labeled with anti-ZAP70 antibody (red hot). (A) Low magnification image of a gill arch illustrating the overall reduced number of T/NK cells in the gills 3 days after infection. This depletion of T/NK cells is particularly striking within the ALT (B, C) and the ILT (D, E). Yellow arrowheads in (A) point to T/NK cells adhering to the endothelium of blood vessels. (F) Low magnification image of two gill arches illustrating the replenishment of the zf-GIALT 10 days after infection. The number of T/NK cells within the ALT (G, H) and the ILT (I, J) is a lot higher; and T/NK cells form small clusters (cyan arrowheads in H, I and J). Images are maximum intensity projections: 2 µm (B–E, G–J) and 5 µm (A, F). Annotations: Aa, Afferent artery; Aaa, Afferent arch artery; ALT, Amphibranchial Lymphoid Tissue; Bc, Branchial cavity; C, Cartilage; Ea, Efferent artery; Ga, Gill arch; ILT, Interbranchial Lymphoid Tissue; La, Lamella; S, Septum and Vb, Vascular bleb. Scale bars: 10 µm (H), 20 μm (B–E, G, I, J) and 50 µm (A, F).

Expression Data

Expression Detail
Antibody Labeling
Phenotype Data

Phenotype Detail
Acknowledgments
This image is the copyrighted work of the attributed author or publisher, and ZFIN has permission only to display this image to its users. Additional permissions should be obtained from the applicable author or publisher of the image. Full text @ Front Immunol