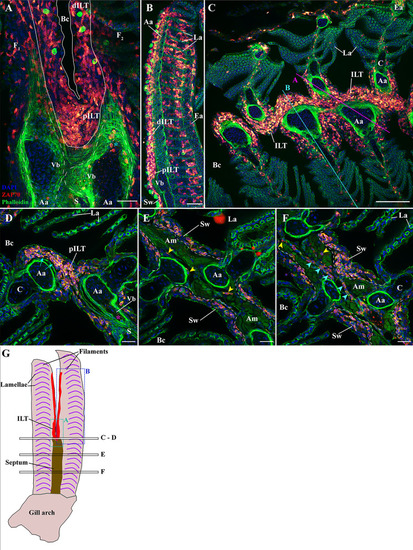
Organization of the zf-GIALT above the gill arch. (Sub-regions 1-3). Representative deconvolved confocal high-resolution images of adult zebrafish gills acquired with a transversal (A, B) or coronal orientations (C–F). The different section planes are illustrated on panels (C) and in (G). Images were acquired from 30 μm whole-body cryosections stained with phalloidin (green) and DAPI (blue) and where T/NK cells were labeled with anti-ZAP70 antibody (red hot). (A) An overview of the top of an interbranchial septum showing the location of the proximal ILT over the vascular bleb from two opposite filaments. The cyan star indicates T/NK cells adhering to the endothelium of the vascular bleb. (B) Transversal acquisition through the middle of a filament illustrating the heterogeneity of the distribution of ZAP70 positive cells within a filament. (C) Coronal section across the proximal ILT showing the continuity of the ILT across the branchial cleft. (D–F) High-resolution images acquired with coronal orientations at different levels through the filaments [see panel (G)] and illustrating the zf-GIALT associated to the interbranchial septum. The cyan arrows in (D) indicate the basement membrane separating the vascular compartment from the ILT, the magenta star highlights a ZAP70neg immune cells within the vascular bleb, yellow arrowheads in (E, F) point to scattered T/NK cells within the septum, and cyan arrowheads in (F) highlight T/NK cells within a vessel of the septum. Images are maximum intensity projections: 2 µm (D–F). Annotations: Aa, Afferent artery; Am, adductor muscles; Bc, Branchial cavity; C, Cartilage; dILT, distal Interbranchial Lymphoid Tissue; Ea, Efferent artery; F, Filament; La, Lamellae; pILT, proximal Interbranchial Lymphoid Tissue; S, Septum; Sw, Septum wall and Vb, Vascular bleb. Scale bars: 100 μm (C) 40 μm (B) 30 μm (A) and 20 μm (D–F).
|
