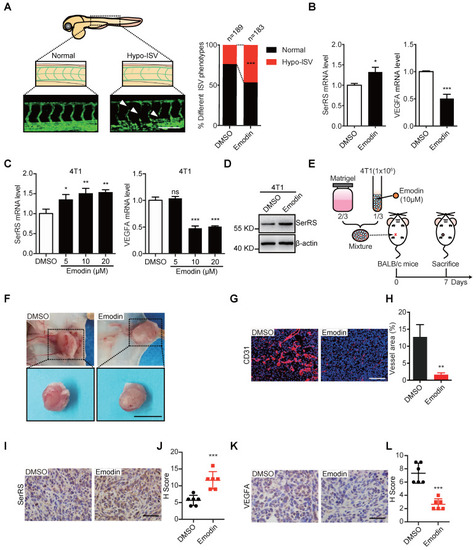
Emodin inhibits angiogenesis in zebrafish embryos and Matrigel plugs. (A) Representative Tg (Fli1a: GFP) zebrafish embryos showing normal and hypo (arrowheads) ISV phenotypes at 3 days post fertilization +/- emodin are shown (left); percentage of embryos with each ISV phenotype (right) (Scale bar, 0.2 mm). (B) mRNA levels of SerRS and VEGFA from Tg (Fli1a: GFP) zebrafish treated with emodin relative to controls (n=3). (C) mRNA levels of SerRS and VEGFA from MDA-MB-231 cells; effect of concentration with emodin. (D) Western blot of SerRS expression in 4T1 cells treated with emodin (10 µM) for 48 h (n=3). (E) Flowchart of Matrigel plug assay. (F) Representative images of Matrigel plugs following vehicle or emodin treatment (n=6). Scale bar, 1 cm. (G) CD31 staining (red) in control and emodin-treated Matrigel plugs. (H) Percent vessel area in Matrigel plugs. Scale bar, 100 µm. (I) SerRS staining of Matrigel plugs. (J) Quantification of SerRS-positive cells (n=6). (K) VEGFA staining in control and emodin-treated Matrigel plugs. (L) Quantification of VEGFA-positive cells (n=6). Scale bar, 100 µm. Scale bar, 100 µm. Data are means ± SD., *p<0.05, ** p<0.01 ***p<0.001; by Chi-square for A; by one-way ANOVA for C; by Student's t-test for B, H, J, L.
|
