IMAGE

Figure 2

ID
ZDB-IMAGE-200621-2
Source
Figures for Zou et al., 2020
Image
Figure Caption

Figure 2

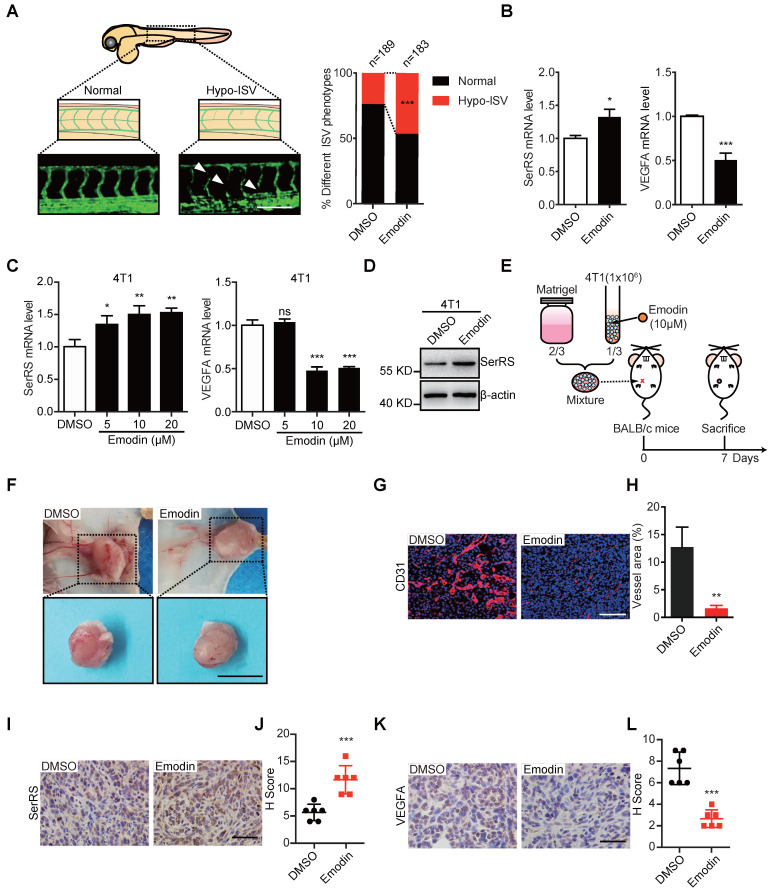
Emodin inhibits angiogenesis in zebrafish embryos and Matrigel plugs. (A) Representative Tg (Fli1a: GFP) zebrafish embryos showing normal and hypo (arrowheads) ISV phenotypes at 3 days post fertilization +/- emodin are shown (left); percentage of embryos with each ISV phenotype (right) (Scale bar, 0.2 mm). (B) mRNA levels of SerRS and VEGFA from Tg (Fli1a: GFP) zebrafish treated with emodin relative to controls (n=3). (C) mRNA levels of SerRS and VEGFA from MDA-MB-231 cells; effect of concentration with emodin. (D) Western blot of SerRS expression in 4T1 cells treated with emodin (10 µM) for 48 h (n=3). (E) Flowchart of Matrigel plug assay. (F) Representative images of Matrigel plugs following vehicle or emodin treatment (n=6). Scale bar, 1 cm. (G) CD31 staining (red) in control and emodin-treated Matrigel plugs. (H) Percent vessel area in Matrigel plugs. Scale bar, 100 µm. (I) SerRS staining of Matrigel plugs. (J) Quantification of SerRS-positive cells (n=6). (K) VEGFA staining in control and emodin-treated Matrigel plugs. (L) Quantification of VEGFA-positive cells (n=6). Scale bar, 100 µm. Scale bar, 100 µm. Data are means ± SD., *p<0.05, ** p<0.01 ***p<0.001; by Chi-square for A; by one-way ANOVA for C; by Student's t-test for B, H, J, L.

Acknowledgments
This image is the copyrighted work of the attributed author or publisher, and ZFIN has permission only to display this image to its users. Additional permissions should be obtained from the applicable author or publisher of the image. Full text @ Theranostics