|
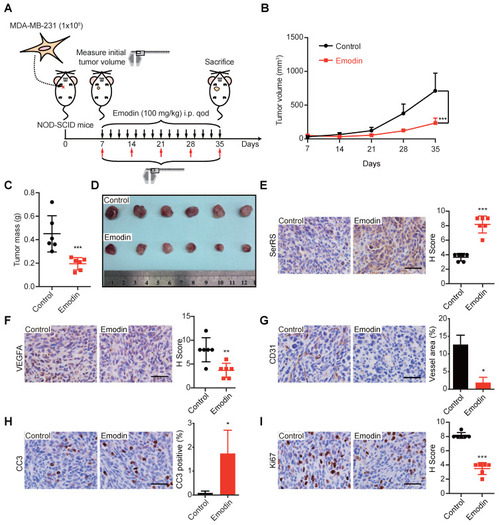
Emodin exhibits antitumor and anti-angiogenesis activity in a xenograft model. (A) Flow diagram of MDA-MB-231 cells implanted orthotopically into the 2nd mammary fat pad of female NOD-SCID mice and treated intraperitoneally with DMSO or emodin every other day until sacrifice (n=6). (B) Tumor growth curve for control and emodin-treated mice. (C) Weight of tumors at sacrifice of the mice. (D) Representative images of primary tumors. (E) Staining for SerRS-positive cells in control and emodin-treated mouse tumors and quantification (n=6). (F) Staining for VEGFA-positive cells in tumors and quantification (n=6). (G) CD31 staining of tumors and quantification of vessel area (n=6). (H) Staining for Cleaved Caspase 3 (CC3)-positive cells in tumors and quantification (n=6). (I) Staining for Ki67-positive cells in tumors and quantification (n=6). Scale bars, 100 µm. Data are means ± SD., *p<0.05, **p < 0.01, ***p < 0.001 by Student's t-test.
|