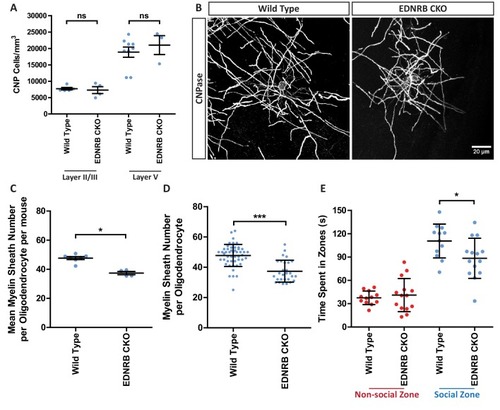
Figure 3—figure supplement 1.

Conditional EDNRB knock out does not affect oligodendrocyte generation or myelin sheath length.

(A) Representative Images of Ednrb mRNA expressing Olig2 mRNA positive oligodendroglia. (B) Ratio of CC1 positive oligodendrocytes over total population of Olig2 positive oligodendroglia. Wild type 0.2086 ± 0.01087 n = 5 mice, EDNRB CKO 0.2003 ± 0.0248 n = 5 mice (mean ± standard error). (C) Number of CC1 and Olig2 positive oligodendrocytes. Wild type 1626 ± 170.6 n = 5 mice, EDNRB CKO 1419 ± 220.5 n = 5 mice (mean ± standard error). (D) Number Olig2 positive oligodendroglia. Wild type 7737 ± 903.8 n = 5 mice, EDNRB CKO 7565 ± 1239 n = 5 mice (mean ± standard error). (E) Mean myelin sheath length formed by oligodendrocytes per mouse. Wild type 46.10 µm ± 2.485 n=seven mice, EDNRB CKO 49.64 µm ± 4.688 n=four mice (mean ± standard error). (F) Frequency distribution of myelin sheath lengths. (G) Distance travelled by mice during 5 min of exploration of the social interaction assay. Wild type 15.48 meters ± 3.326 n = 12 mice, EDNRB CKO 17.62 meters ± 3.677 n = 9 mice (mean ± standard deviation). (H) Maximum speed travelled by mice during 5 min of exploration of the social interaction assay. Wild type 0.2433 ± 0.04117 n = 12 mice, EDNRB CKO 0.2748 meters ± 0.05095 n = 14 mice (mean ± standard deviation).

Expression Data

Expression Detail
Antibody Labeling
Phenotype Data

Phenotype Detail
Acknowledgments
This image is the copyrighted work of the attributed author or publisher, and ZFIN has permission only to display this image to its users. Additional permissions should be obtained from the applicable author or publisher of the image. Full text @ Elife