
FIGURE
Fig. S5
Fig. S5
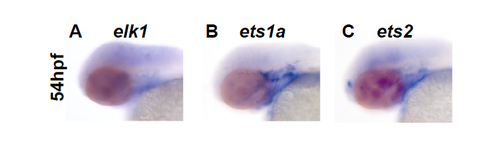
Expression of the Ets factors elk1, ets1a and ets2. (A-C) All three factors are expressed in regions around the developing bone at 54hpf, with ets1a and ets2 showing the highest expression. |
Expression Data
| Genes: | |
|---|---|
| Fish: | |
| Anatomical Term: | |
| Stage: | Long-pec |
Expression Detail
Antibody Labeling
Phenotype Data
Phenotype Detail
Acknowledgments
This image is the copyrighted work of the attributed author or publisher, and
ZFIN has permission only to display this image to its users.
Additional permissions should be obtained from the applicable author or publisher of the image.
Full text @ PLoS One