FIGURE SUMMARY
Title

The development of brain pericytes requires expression of the transcription factor nkx3.1 in intermediate precursors

Authors
Ahuja, S., Adjekukor, C., Li, Q., Kocha, K.M., Rosin, N., Labit, E., Sinha, S., Narang, A., Long, Q., Biernaskie, J., Huang, P., Childs, S.J.
Source
Full text @ PLoS Biol.

nkx3.1 expression patterns and cell behavior.

All images are captured dorsally and the anterior (A) and posterior (P) axis is marked. (A-C) Expression of nkx3.1 by HCR in situ hybridization. (A) At 16 hpf, nkx3.1 is expressed in the hindbrain and anterior trunk. Arrowheads mark nkx3.1 expression. (B) At 30 hpf, nkx3.1 is expressed in the posterior head and trunk. (C) At 48 hpf, nkx3.1 expression is not detectable. (D-E’) nkx3.1NTR-mcherry cells (red) are adjacent to endothelium (green; Tg(flk:GFP)) in brain vessels at 4 dpf. Pericytes in midbrain (arrowheads, E, F) and hindbrain (arrowheads, E’, F’) are denoted in dual channel (E, E’) and single-channel pericyte (F, F’) images. (G) Brain pericytes labelled by TgBAC(pdgfrβ:GFP) coexpress nkx3.1NTR-mcherry 75 hpf. (H) Enlargement of an individual brain pericyte marked by a square in G. (I) Quantification brain pericytes coexpressing nkx3.1 at 75 hpf (N = 3 experiments and 30 embryos). (J-M) Single images from time-lapse of nkx3.1NTR-mcherry cells in the midbrain. White and yellow arrowheads track individual cells that migrate and divide with time. Scale bar in all images is 50 μm.

Nkx3.1 function is required to regulate brain pericyte numbers.

Lateral view of control nkx3.1+/− (A) and nkx3.1−/− MZ (B) mutants showing brain hemorrhage (arrowhead) at 52 hpf, and quantification (C; N = 3, proportions of hemorrhage). (D) nkx3.1−/− have decreased CtA vessel diameter in comparison to nkx3.1+/− hets. Dorsal images of nkx3.1+/− hets (E) and nkx3.1−/− (F) embryos expressing Tg(pdgfrβ:GFP) and Tg(kdrl:mCherry) showing fewer brain pericytes (arrows) in mutants at 75 hpf. Quantification of (G) decreased pericyte number and (H), decreased pericyte density (defined as the number of pericytes divided by the length of the vessel network) in mutants. In comparison to control wild-type embryos (I, Tg(hsp70l:tBFP), nkx3.1 gain-of-function (GOF) embryos expressing Tg(hsp70l:tBFP-2a-nkx3.1)) show more pericytes (J, arrowheads) (n = 20 control and 19 GOF)) as quantified (K). Pericyte density is also increased (L). Dorsal views of embryos labelled with TgBAC(nkx3.1:Gal4) and Tg(UAS:NTR-mCherry) under fluorescence (M, N) or under brightfield (O, P) that are untreated (M, O) or treated with metronidazole (N, P) to ablate nkx3.1-expressing cells. Ablated embryos show brain hemorrhage (P, arrowhead) at 48 hpf (P). (Q) Quantification of pericyte number in ablated embryos. Statistical significance was calculated using the Student t test (n = 5 wild type and 11 nkx3.1 mutants). Scale bars are 50 μm. The data underlying this figure can be found in S3 Table.

Next-generation sequencing analysis of nkx3.1NTR-mcherry and nkx3.1−/− embryos at 30 hpf.

(A) Single-cell clusters of nkx3.1NTR-mcherry embryos at 30 hpf. (B) Schematic showing workflow for single-cell sequencing of nkx3.1NTR-mcherry cells. (C) RNA-velocity analysis of subclustered nkx3.1NTR-mcherry cells of the Progenitor and FB-V, FB-A, and Fb-B clusters. (D) Dot plots showing key marker genes of FB-V, FB-A, and Fb-B clusters. (E-M) HCR expression analysis of Fb-V genes at 36 hpf with the schematic showing relative locations of the ventral head mesenchyme and the forming basilar artery in a dorsal schematic of the whole zebrafish brain (grey marks the position of the eyes). (E-M) HCR fluorescent in situ hybridization imaged by confocal showing substacks in the region of the forming basilar artery and precursor area. (E-G) tbx18 (red) and foxf2a (green) show expression overlap at 36 hpf in the ventral head (yellow, arrowheads). (H-J) tbx18 (red) and cxcl12b (green) show expression overlap at 36 hpf in the ventral head (yellow, arrowheads). (K-M) tbx18 (red) is expressed in the perivascular space surrounding the cxcr4a (green) expressing basilar artery in the ventral head at 36 hpf. (N) cxcl12b feature plot showing its expression across clusters including Fb-V. (O) Bulk sequencing volcano plot of nkx3.1−/− embryos at 30 hpf. Scale bar is 50 μm.

cxcl12b is regulated by nkx3.1; loss of Cxcr4 signaling reduces brain pericytes.

All embryos were imaged dorsally in the head region. cxcl12b mRNA expression is reduced in the embryonic head of nkx3.1−/− mutants (B) as compared to wild-type controls (A) at 30 hpf as quantified by fluorescent intensity (C) of regions marked by dotted lines in A and B. (n = 10 wild-type and 10 mutant embryos). Inhibition of Cxcr4 from 24–75 hpf using AMD 3100 leads to reduced brain pericytes in treated (E) vs. untreated (D) embryos (at 75 hpf (n = 10)). Pericytes (red cells, white arrows) are labeled by TgBAC(pdgfrβ:Gal4); Tg(UAS:NTR-mCherry). Brain vessels in D and E are labeled by Tg(flk:GFP; green). Quantification of (F) pericyte number and (G) pericyte density. (n = 10 wild type and 10 mutants). Statistical significance was calculated using the Student t test. Scale bar is 50 μm. The data underlying this figure can be found in S3 Table.

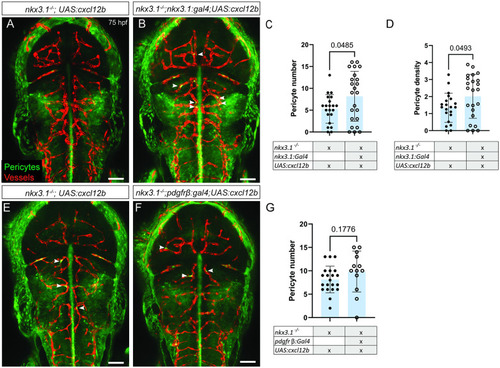
Reexpression of Cxcl12b increases pericyte numbers in nkx3.1/.

All embryos were imaged dorsally in the head region. In comparison to a nkx3.1−/− mutant without a Gal4 driver (A), expressing UAS:cxcl12b under the nkx3.1 Gal4 driver TgBAC(nkx3.1:Gal4) increases pericyte numbers (B, C) and pericyte density (D) in nkx3.1 mutants at 75 hpf (n = 21 mutants without nkx3.1Gal4 and 22 with Gal4). In comparison to a nkx3.1−/− mutant without a Gal4 driver (E), expressing UAS:cxcl12b under the under the pdgfrβ Gal4 driver TgBAC(pdgfrβ:Gal4) does not change pericyte numbers at 75 hpf (F, G; n = 16 mutants without the pdgfrβ:Gal4, and 8 with pdgfrβ:Gal4). Arrowheads mark example brain pericytes (green) labeled by TgBAC(pdgfrβ:GFP). Brain vessels (red) are labeled by Tg(kdrl:mCherry). Statistical significance was calculated using the Student t test. Scale bar is 50 μm. The data underlying this figure can be found in S3 Table.

nkx3.1 is essential in pericyte precursors.

Model of nkx3.1 in pericyte differentiation. nkx3.1 is expressed in cells of both mesodermal and neural crest origin as determined by lineage analysis. All embryo schematics show a dorsal view of the hindbrain. At 16 and 24 hpf, nkx3.1 and cxcl12b coexpressing precursors are located ventrolaterally. At 36 hpf, nkx3.1, cxcl12b, tbx18, and foxf2 coexpressing precursors surround the developing basilar artery (BA). By 75 hpf, pdgfrβ-expressing pericytes derived from nkx3.1 precursors have migrated to the central arteries of the brain. Key genetic markers are indicated.

Acknowledgments
This image is the copyrighted work of the attributed author or publisher, and ZFIN has permission only to display this image to its users. Additional permissions should be obtained from the applicable author or publisher of the image. Full text @ PLoS Biol.