IMAGE

Fig 3

ID
ZDB-IMAGE-240511-3
Source
Figures for Ahuja et al., 2024
Image
Figure Caption

Fig 3 
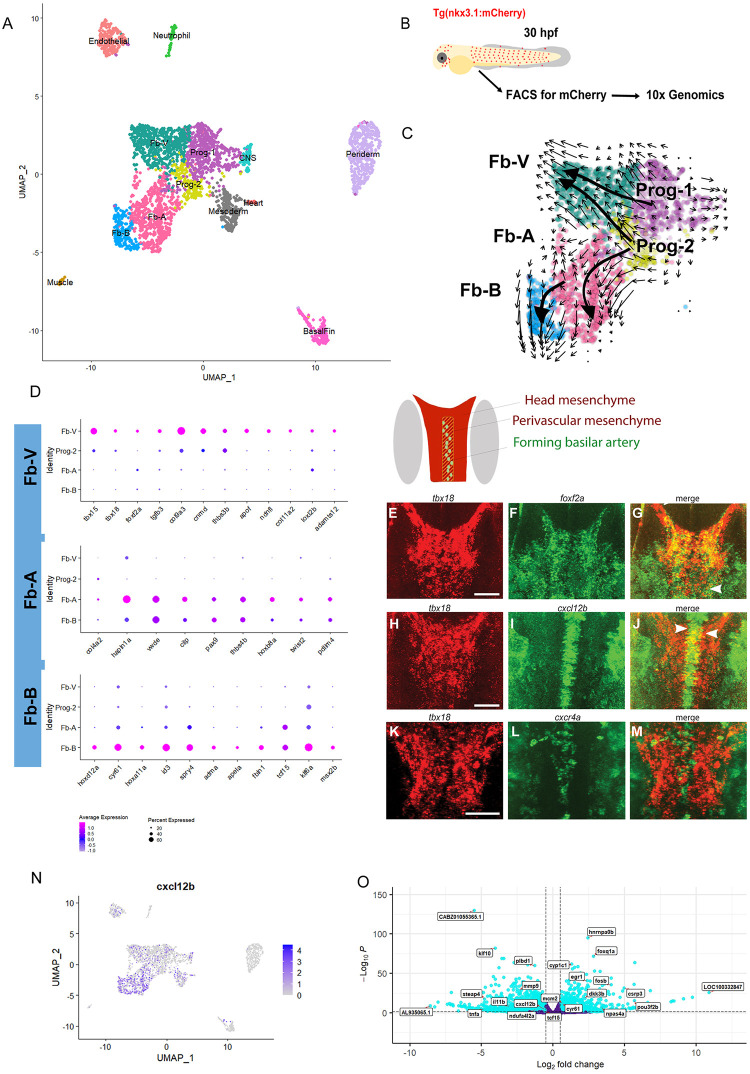
Next-generation sequencing analysis of nkx3.1NTR-mcherry and nkx3.1−/− embryos at 30 hpf.

(A) Single-cell clusters of nkx3.1NTR-mcherry embryos at 30 hpf. (B) Schematic showing workflow for single-cell sequencing of nkx3.1NTR-mcherry cells. (C) RNA-velocity analysis of subclustered nkx3.1NTR-mcherry cells of the Progenitor and FB-V, FB-A, and Fb-B clusters. (D) Dot plots showing key marker genes of FB-V, FB-A, and Fb-B clusters. (E-M) HCR expression analysis of Fb-V genes at 36 hpf with the schematic showing relative locations of the ventral head mesenchyme and the forming basilar artery in a dorsal schematic of the whole zebrafish brain (grey marks the position of the eyes). (E-M) HCR fluorescent in situ hybridization imaged by confocal showing substacks in the region of the forming basilar artery and precursor area. (E-G) tbx18 (red) and foxf2a (green) show expression overlap at 36 hpf in the ventral head (yellow, arrowheads). (H-J) tbx18 (red) and cxcl12b (green) show expression overlap at 36 hpf in the ventral head (yellow, arrowheads). (K-M) tbx18 (red) is expressed in the perivascular space surrounding the cxcr4a (green) expressing basilar artery in the ventral head at 36 hpf. (N) cxcl12b feature plot showing its expression across clusters including Fb-V. (O) Bulk sequencing volcano plot of nkx3.1−/− embryos at 30 hpf. Scale bar is 50 μm.

Acknowledgments
This image is the copyrighted work of the attributed author or publisher, and ZFIN has permission only to display this image to its users. Additional permissions should be obtained from the applicable author or publisher of the image. Full text @ PLoS Biol.