
- Title
-
Lian-Mei-Yin formula alleviates diet-induced hepatic steatosis by suppressing Yap1/FOXM1 pathway-dependent lipid synthesis
- Authors
- Zhang, P., Cao, J., Liang, X., Su, Z., Zhang, B., Wang, Z., Xie, J., Chen, G., Chen, X., Zhang, J., Feng, Y., Xu, Q., Song, J., Hong, A., Chen, X., Zhang, Y.
- Source
- Full text @ Acta. Biochim. Biophys. Sin (Shanghai)
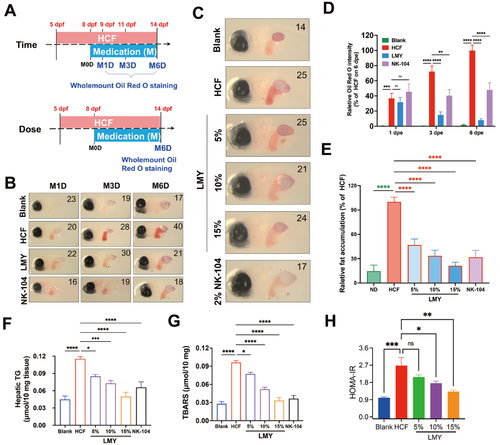
LMY alleviates HCF-induced hepatic lipid accumulation in zebrafish(A) Scheme of HCF diet induction and drug treatments for studying the time course and dose effect of LMY in larval zebrafish. (B) Typical oil red O staining images showing the alleviation of lipid accumulation over time by LMY in larval zebrafish. The number of zebrafish larvae involved in each experimental group is indicated in the top left corner of each image. (C) Typical oil red O staining images showing the dose-dependent alleviation of lipid accumulation by LMY in larval zebrafish. The number of zebrafish larvae involved in each experimental group is indicated in the top left corner of each image. (D) Relative quantification of the time course through which lipid accumulation alleviated the effect of LMY in larval zebrafish. The average oil red O staining intensity of HCF-fed zebrafish on M6D was defined as 100%. (E) Quantification of the dose-dependent alleviation of lipid accumulation by LMY in zebrafish. The average oil red O staining intensity of HCF-fed zebrafish was defined as 100%. (F) Quantification of the liver TG concentration in adult zebrafish treated with different doses of LMY or NK-104. (G) Quantification of the liver MDA concentration (TBARS value) in adult zebrafish treated with different doses of LMY or NK-104. (H) Quantification of the HOMA-IR index in adult zebrafish treated with different doses of LMY. For TG, MDA, and HOMA-IR analysis, adult zebrafish were randomly selected at the age of 12 weeks postfertilization (wpf) and were administered the HCF diet for four weeks, except the blank group. HCF-diet-induced zebrafish were then treated with different doses of LMY or NK104 for another four weeks. The livers of these zebrafish were then harvested for TG, MDA, and HOMA-IR analysis. Six individuals were included in each experimental group (n=6). All these experiments were conducted three times in a double-blind manner, and the quantification results are presented as the mean±SEM. *P<0.05, **P<0.01, ***P<0.001, and ****P<0.0001. ns, no significance. |
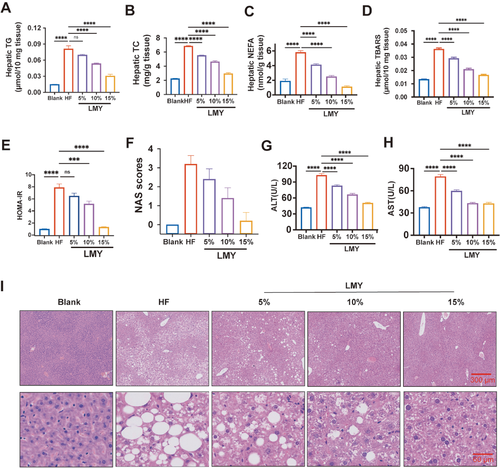
LMY alleviates HCF-induced hepatic lipid accumulation in miceQuantification of hepatic TG (A), TC (B), NEFA (C), MDA (D), blood glucose (E), HOMA-IR (F), and serum ALT (G) and AST (H) levels in HF-related food-induced NAFLD mice treated with or without LMY. Normal diet-fed mice were used as blank controls. (I) Typical H&E staining images of the liver of blank, HF-fed, and LMY-treated mice. C57BL/6 mice were randomly selected at the age of 10 weeks. The HF diet was given to the mice for 6 weeks, except the blank group, which was subjected to LMY treatment for another 6 weeks. The serum of these treated mice was harvested for ALT and AST measurements, while their livers were dissected for TG, TC, NEFA, and MDA quantification, as well as paraffin sections for HE staining. Six individuals were included in each treatment group (n=6). All these experiments were conducted three times in a double-blind manner, and the quantification results are presented as the mean±SEM. ***P<0.001, and ****P<0.0001. ns, no significance. |
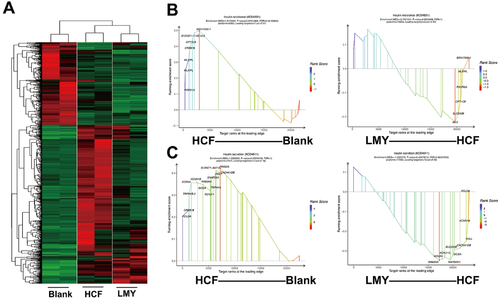
LMY antagonizes the NAFLD-prone transcriptome induced by the HCF diet in zebrafish liver(A) Heatmaps represent the treatment groups’ DEGs. The adult zebrafish were first fed with the HCF diet for four weeks before being administered with LMY for another four weeks. The livers of the treated fish were then harvested for RNA-seq. (B) GSEA curve of the insulin resistance subset with plots of significantly-changed genes. (C) GSEA curve of the insulin secretion subset with significantly-changed genes. Considering that the KEGG analysis only demonstrates the difference between the two groups, we cannot obtain information on how the genes changed in an enriched pathway. Hence, GSEA was performed to analyze the RNA-seq data further. We found that the HCF diet particularly elevated insulin secretion and insulin resistance-related pathway activity in the zebrafish liver. These pathways were partially reversed by LMY treatment (Figure 3B,C), suggesting that the classical endocrine regulatory activity of LMY is similar to its clinical application. |
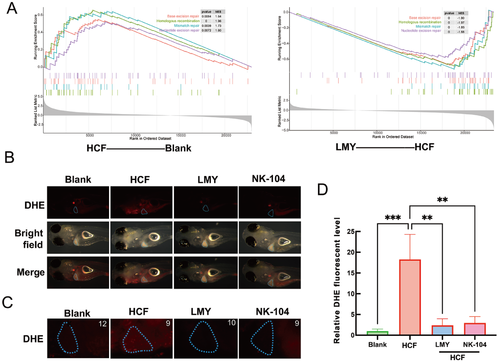
LMY ameliorates HCF diet-induced oxidative stress in vivo(A) GSEA analysis for DEGs enriched in DNA damage and repair pathways. The color of the curves represents the corresponding pathway labeled on the graph; Typical overall (B) and liver (C) images represent the superoxide in the zebrafish after different treatments. The Casper larvae were first fed with the HCF diet for three days, followed by a 6-day treatment with LMY and NK-104. The superoxide concentration was then determined by incubation with a DHE probe. The blue circle represents the liver area. (D) Quantification of red DHE fluorescence in the liver area. The red fluorescence intensity of HCF-fed zebrafish was defined as 100%. All these experiments were conducted three times in a double-blind manner, and the quantification results are presented as the mean±SEM. The number of zebrafish larvae involved in each experimental group is indicated in the top left corner of each image. **P<0.01, ***P<0.001. To further analyze the LMY therapeutic mechanism on NAFLD, a network was constructed via IPA, which revealed that several inflammation-related genes, CSF1/2, might play critical roles in the anti-NAFLD activity of LMY (Figure 5A). Considering that inflammation might be involved in NAFLD, especially when liver cells undergo oxidative stress and DNA damage, a colo1a: EGFP transgenic Casper zebrafish was used. In this transgenic line, macrophages and neutrophils were labeled with green fluorescence, allowing us to observe inflammation in living individuals. The results demonstrated that the HCF diet initiated inflammation in the zebrafish liver, as indicated by the aggregation of macrophages and neutrophils in the liver area. This inflammation was reversed after treatment with LMY for 6 days (Figure 5B‒D). These results indicate that LMY reverses HCF diet-induced inflammation in the liver. |
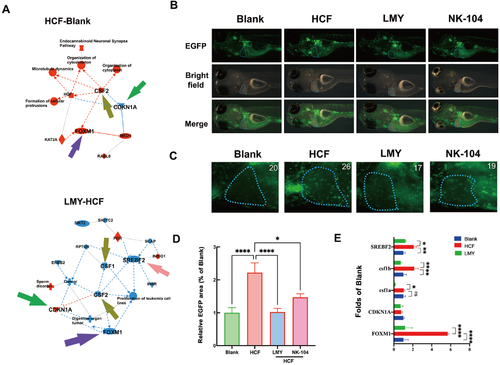
LMY ameliorates HCF diet-induced inflammation in the zebrafish liver(A) IPA of the transcriptomic data. The red nodes indicate activation, while the blue nodes indicate inhibition; Typical overall (B) and liver (C) images represent inflammatory cell infiltration in zebrafish subjected to different treatments. Colo1a: EGFP-based Casper larvae were first fed with an HCF diet for three days, followed by 6 days of treatment with LMY and NK-104. The transgenic EGFP fluorescence indicates neutrophils and macrophages. The blue circle represents the liver area. (D) Quantification of the green fluorescence in the liver area. The green fluorescence intensity of HCF-fed zebrafish was defined as 100%. (E) Quantification of the key genes involved in cholesterol synthesis, inflammation, and DNA damage identified by IPA. All these experiments were conducted three times in a double-blind manner, and the quantification results are presented as the mean±SEM. The number of zebrafish larvae involved in each experimental group is indicated in the top left corner of each image. *P<0.05, **P <0.01, ***P<0.001, and ****P<0.0001. |
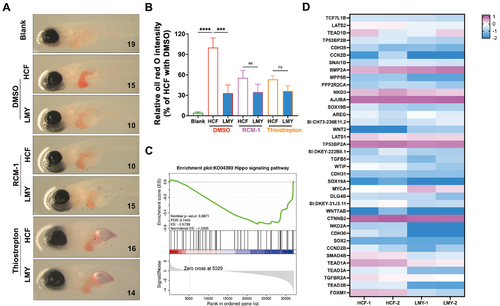
LMY reduces hepatic lipid accumulation in a FOXM1-dependent manner via Yap1 activity(A) Typical oil red O staining images showing the alleviation of lipid accumulation in LMY cells treated with or without FOXM1 inhibitors (RCM-1 and Thiostrepton). The numbers in each image refer to the number of fish in each treatment group. (B) Quantification of the alleviating effect of LMY on lipid accumulation in the presence or absence of FOXM1 inhibitors. The average oil red O staining intensity of HCF-fed zebrafish treated with DMSO was defined as 100%. (C) GSEA curve of genes associated with the Hippo signaling pathway. (D) Heatmap of the DEGs within the Hippo and FOXM1 signaling pathways. All these experiments were conducted three times in a double-blind manner, and the quantification results are presented as the mean±SEM. *P<0.05, **P <0.01, ***P<0.001, and ****P<0.0001. ns, no significance. LMY ameliorates lipid accumulation through the inhibition of Yap1 activity Interestingly, FOXM1 activation is closely related to Yap1, and Yap1 was also recently proven to stimulate lipid synthesis [57]; therefore, we further investigated whether Yap1 is involved in the therapeutic effect of LMY on NAFLD. The results demonstrated that the expression of Hippo pathway genes was significantly reduced in the livers of LMY-treated zebrafish according to the GSEA results (Figure 6C,D). To investigate the importance of Yap1 in the therapeutic effect of LMY on NAFLD, the Yap1 inhibitor verteporfin was used to block the activation of Yap1. The results demonstrated that LMY significantly reduced hepatic lipids, while the therapeutic effect of LMY was not significant in the presence of verteporfin (Figure 7A,B), indicating that Yap1 activity is vital for the hepatic lipid-reducing effect of LMY. |
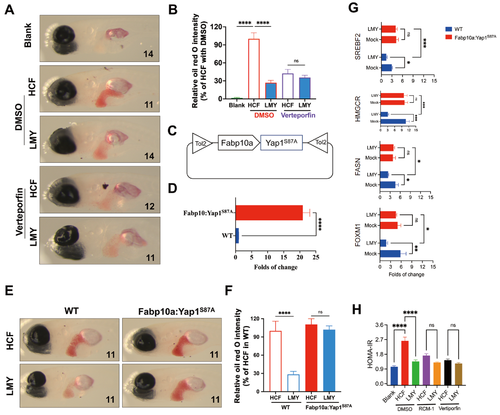
LMY reduces hepatic lipid accumulation through the inhibition of Yap1 activity(A) Typical oil red O staining images showing the alleviation of lipid accumulation in LMY cells treated with or without a Yap1 inhibitor (verteporfin). (B) Quantification of the alleviating effect of LMY on lipid accumulation in the presence or absence of the Yap1 inhibitor. The average oil red O staining intensity of HCF-fed zebrafish treated with DMSO was defined as 100%. (C) Scheme of the transgenic plasmid used to induce activated Yap1 overexpression in the zebrafish liver. (D) Quantification of the transcript level of Yap1 in the livers of WT and Yap1-overexpressing zebrafish livers. (E) Typical oil red O staining images showing lipid accumulation in HCF diet-fed WT and Yap1 liver-overexpressing zebrafish with or without LMY. (F) Quantification of lipid accumulation in HCF diet-fed WT and Yap1-overexpressing zebrafish with or without LMY. The average oil red O staining intensity of HCF-fed WT zebrafish was defined as 100%. The numbers in each image refer to the number of fish in each treatment group. (G) Quantification of SREBF2, HMGCR, FASN, and FOXM1 in WT and Yap1-overexpressing zebrafish treated with or without LMY. (H) HOMA-IR indices of zebrafish cultured in the presence or absence of Yap1 or FOXM1 inhibitors. All these experiments were conducted three times in a double-blind manner, and the quantification results are presented as the mean±SEM. *P<0.05, **P <0.01, ***P<0.001, and ****P<0.0001. ns, no significance. |