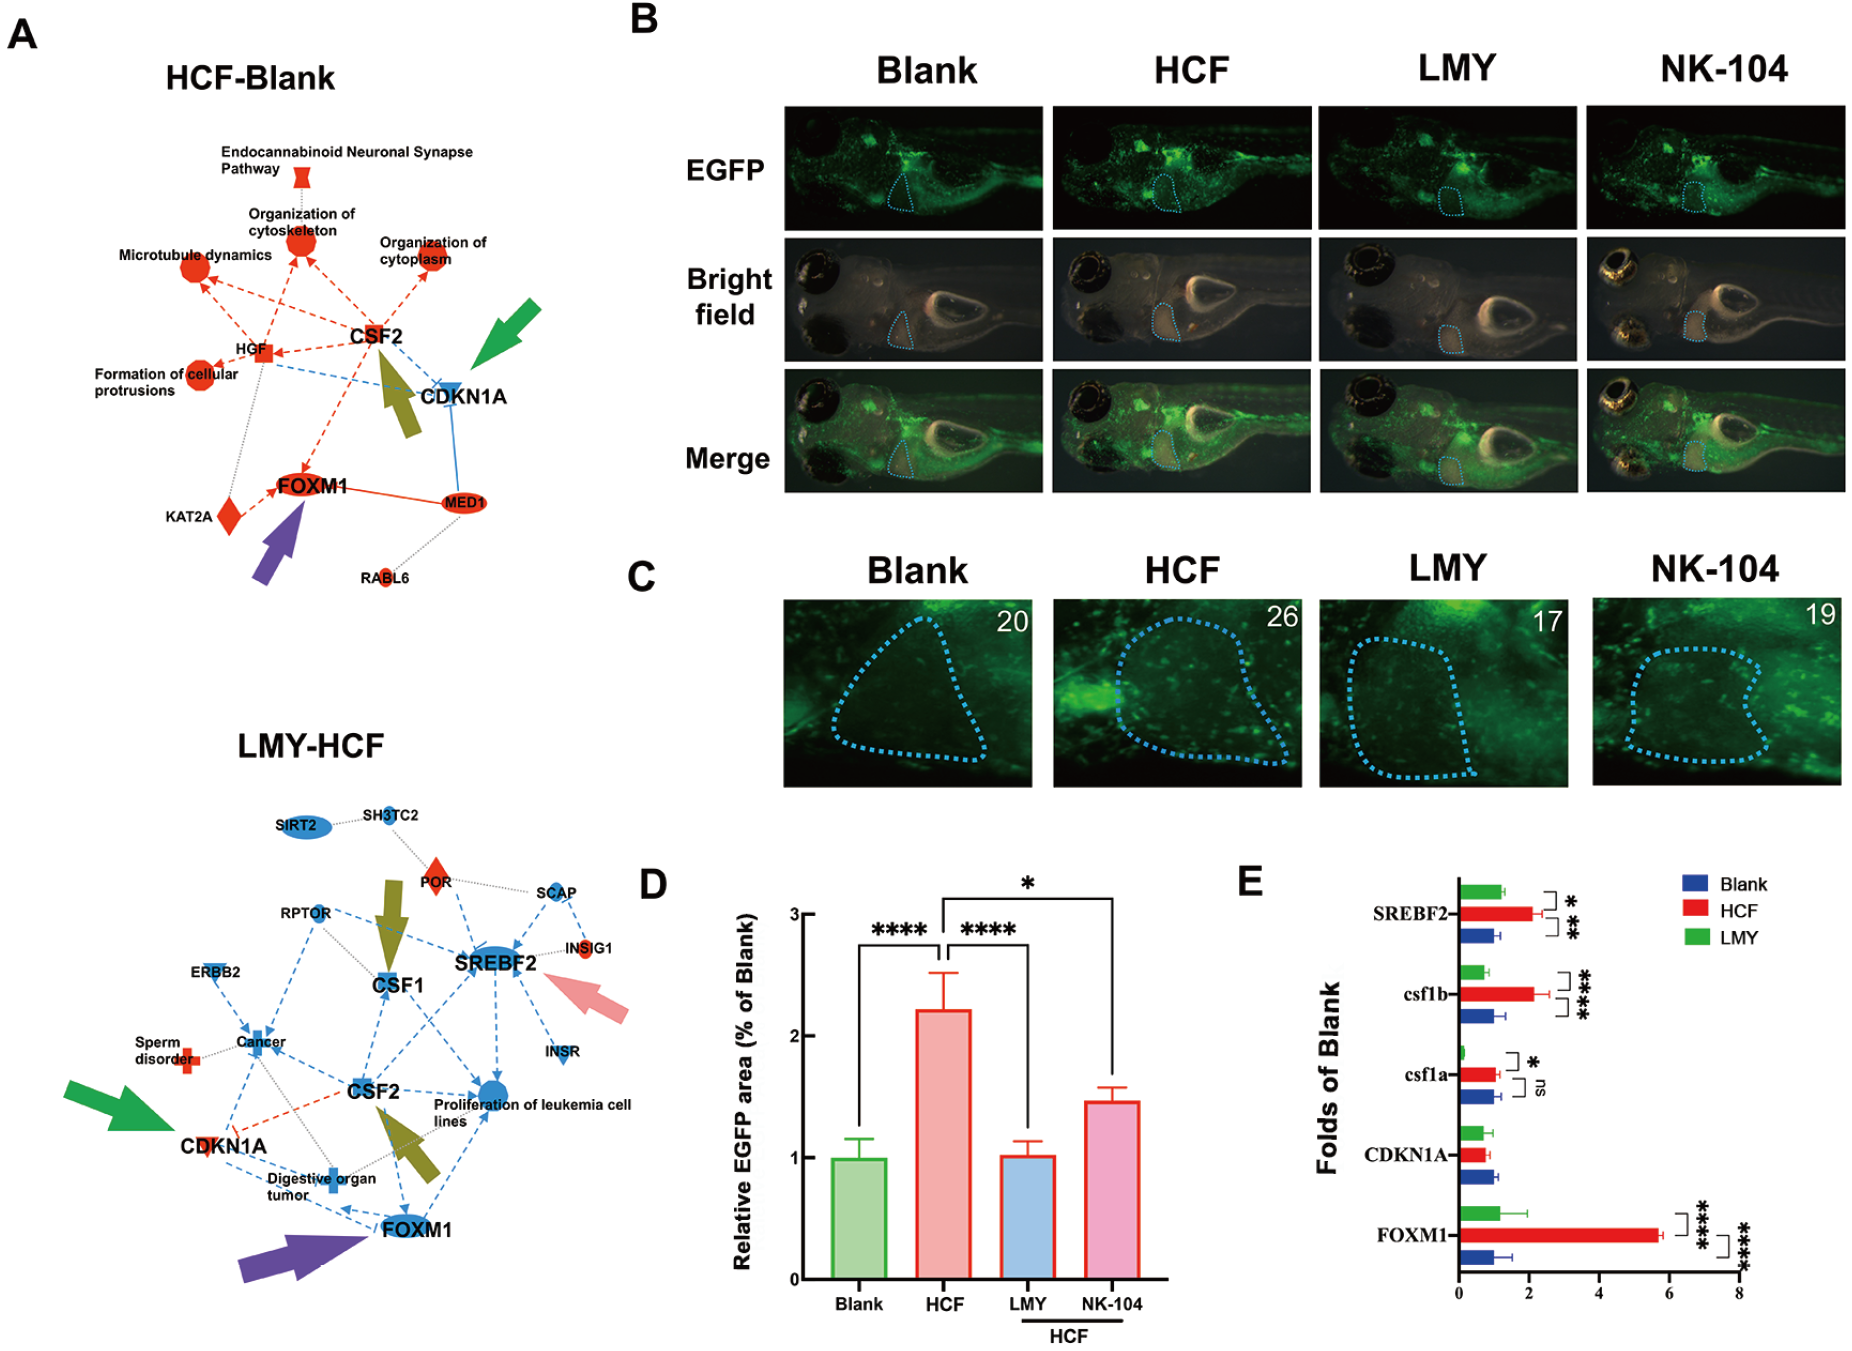
Fig. 5 LMY ameliorates HCF diet-induced inflammation in the zebrafish liver(A) IPA of the transcriptomic data. The red nodes indicate activation, while the blue nodes indicate inhibition; Typical overall (B) and liver (C) images represent inflammatory cell infiltration in zebrafish subjected to different treatments. Colo1a: EGFP-based Casper larvae were first fed with an HCF diet for three days, followed by 6 days of treatment with LMY and NK-104. The transgenic EGFP fluorescence indicates neutrophils and macrophages. The blue circle represents the liver area. (D) Quantification of the green fluorescence in the liver area. The green fluorescence intensity of HCF-fed zebrafish was defined as 100%. (E) Quantification of the key genes involved in cholesterol synthesis, inflammation, and DNA damage identified by IPA. All these experiments were conducted three times in a double-blind manner, and the quantification results are presented as the mean±SEM. The number of zebrafish larvae involved in each experimental group is indicated in the top left corner of each image. *P<0.05, **P <0.01, ***P<0.001, and ****P<0.0001.
Image
Figure Caption
Acknowledgments
This image is the copyrighted work of the attributed author or publisher, and
ZFIN has permission only to display this image to its users.
Additional permissions should be obtained from the applicable author or publisher of the image.
Full text @ Acta. Biochim. Biophys. Sin (Shanghai)

