FIGURE SUMMARY
Title

TBC1D23 mediates Golgi-specific LKB1 signaling

Authors
Tu, Y., Yang, Q., Tang, M., Gao, L., Wang, Y., Wang, J., Liu, Z., Li, X., Mao, L., Jia, R.Z., Wang, Y., Tang, T.S., Xu, P., Liu, Y., Dai, L., Jia, D.
Source
Full text @ Nat. Commun.

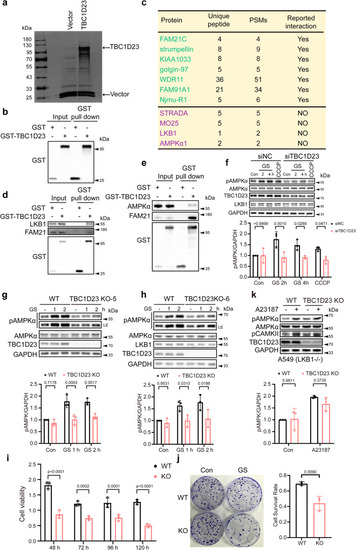
TBC1D23 is an interactor of LKB1 and is required for stress-induced AMPK activation.

a Silver staining gel of proteins precipitated from HEK293T cells transfected with GST-TBC1D23 or GST-empty vector. Specific TBC1D23-interacting proteins were resolved by SDS-PAGE and silver staining, followed by mass spectrometry. b The enrichment of TBC1D23 is confirmed by western blotting and IP-MS data (Supplementary Data 1). c Partial list of proteins identified by mass spectrometry analysis. PSMs: peptide-to-spectrum matches. d, e HEK293T cells were transfected with GST-vector or GST-TBC1D23, followed by pull down assay with GST beads and immunoblotting with indicated antibodies. f HUVEC cells transduced with control siRNA or siTBC1D23 were subjected to glucose starvation (GS) for the indicated time, or treated with CCCP (20 μΜ, 4 h). g, h WT, TBC1D23 KO single clone KO-5 (g) and KO-6 (h) HepG2 cells glucose starved for the indicated time were lysed and subjected to immunoblotting. LE: long exposure. i, j WT or TBC1D23 KO HepG2 cells were glucose starved for 12 h, and cultured for the indicated time. The cell viability was normalized to that of 0 h (i).WT vs KO: 48 h, p value: 1.95e−008; 72 h, p value: 1.65e−004; 96 h, p value: 1.27e−004; 120 h, p value: 3.62e−007; WT and TBC1D23 KO HepG2 cells were subjected to glucose starvation for 12 h and cultured for 14 days, then stained by crystal violet. The number of colonies and cell survival rate were normalized to control cells without glucose starvation. Data are the mean of biological replicates from a representative experiment (j). k WT and TBC1D23 KO A549 cells were incubated with or without 2 μM A23187 for 30 min; cells were then lysed and analyzed by indicated antibodies. The graph shows the levels of pAMPK quantified by densitometry and normalized to GAPDH (f, g, h, k). Experiments were performed in triplicate (dk). Quantification data are the mean ± SD (fk), with p values calculated by two-way ANOVA, followed by Sidak’s test (f, g, h, i, k), or by unpaired two-tailed t test (j). Source data are provided as a Source data file.

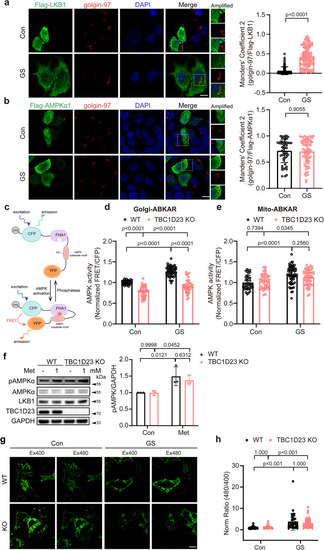
Deletion of TBC1D23 specifically impairs Golgi-AMPK activation.

a HepG2 cells were transiently transfected with Flag-LKB1 for 24 h, and incubated with or without glucose-free medium for 2 h. Cells were stained with antibodies against Flag and golgin-97, a Golgi marker. Scale bar, 10 μm. Mander’s coefficient 2 (golgin-97 overlapping with Flag-LKB1) were graphed as mean ± SD. p value: 2.41e−030. b HepG2 cells transiently transfected with Flag-AMPKα1 were subjected to glucose starvation for 2 h. Scale bar, 10 μm. Mander’s coefficient 2 (golgin-97 overlapping with Flag-AMPKα1) were graphed as mean ± SD. Each dot represents Manders’ coefficients from one cell (a, b). c Schematic diagram of subcellular compartment-specific biosensor osABKAR. d, e WT and TBC1D23 KO HepG2 cells transiently transfected with Golgi-ABKAR (d) or Mito-ABKAR (e) were incubated with glucose-free medium for 2 h and 4 h, respectively. The FRET/CFP ratio of WT cells incubated with DMEM was set as 1, and FRET/CFP ratio of other groups was normalized to WT cells incubated with DMEM. d WT Con vs KO Con: p value: 1.47e−011; WT GS vs KO GS: p value: 0.00e + 000; WT Con vs WT GS: p value: 0.00e + 000; KO Con vs KO GS, p value: 4.07e−005. e WT Con vs WT GS: p value: 1.91e−005. f WT and TBC1D23 KO HepG2 cells were treated with or without 1 mM metformin for 2 h. Cells lysates were analyzed by immunoblotting. The graph shows the levels of pAMPK quantified by densitometry using Image J software and normalized to GAPDH. g, h WT and TBC1D23 KO HepG2 cells transiently transfected with Lyso-ExRai-AMPKAR for 24 h were incubated with or without glucose-free medium for 2 h. Representative images (g) and statistical analysis (h) of Lyso-AMPK activity measured by Lyso-ExRai-AMPKAR. Scale bar, 10 μm. Similar results were obtained in three independent experiments (ah). ah Statistical data are presented as mean ± SD. P values were determined by unpaired two-tailed Mann–Whitney test (a, b), or by two-way ANOVA, followed by Sidak’s test (df), or by Scheirer-Ray-Hare Test (h). Source data are provided as a Source data file.

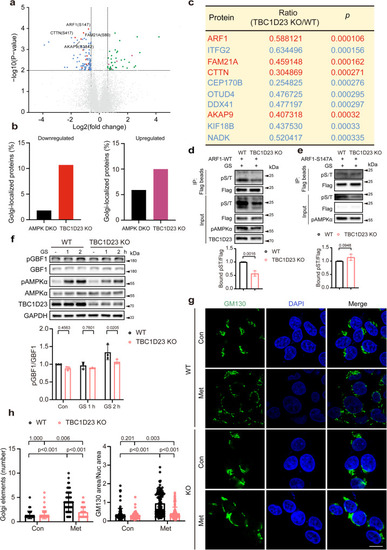
TBC1D23 preferentially regulates the phosphorylation of Golgi-localized proteins, and TBC1D23 loss prevents Golgi disassembly.

a Volcano plot of quantitative analysis of phosphopeptides identified by MS. Blue or red: peptides with fold-change (TBC1D23 KO:WT) < 0.67 (p < 0.01, t-test); green or purple: peptides with fold-change (TBC1D23 KO:WT) > 1.5 (p < 0.01, t-test); red or purple: golgi-localized proteins; gray: no significant difference. b Combined analysis of phosphosites identified from AMPK DKO (AMPKα1/α2 double knockout) cells and TBC1D23 KO cells. The proportion of Golgi-localized proteins was determined. c Top 10 phosphosites with higher levels of phosphorylation in WT cells than TBC1D23 KO cells, ranked by p value. Golgi-localized proteins were shown in red color. d, e Constructs encoding Flag-tagged ARF1 WT (d) or S147A mutant (e) were transfected into WT or TBC1D23 KO HEK293T cells. 24 h later, cells glucose starved for 2 h were collected and subjected to immunoprecipitation using Flag beads and immunoblotting. The graph showed ratios of bound pST to Flag quantified by densitometry using Image J software. f WT and TBC1D23 KO HEK293T were glucose starved for the indicated time, and cell lysates were subjected to immunoblotting. The graph shows the levels of pGBF1 quantified by densitometry using Image J software and normalized to GBF1. g, h WT and TBC1D23 KO HepG2 cells were treated with or without 10 mM metformin for 4 h. The cells were stained with an anti-GM130 (Golgi marker) antibody. Representative confocal images (g) and quantitation of Golgi elements in cells as treated in (g) (h, left panel). Scale bar, 10 μm. The ratio between the total area occupied by GM130 and DAPI was also used to indicate Golgi disassembly (h, right pannel). Each dot in the figure represents the ratio GM130 area/nucleus area from one cell. Similar results were obtained in three independent experiments (dh). Results are presented as mean ± SD (dh). P values were determined by unpaired two-tailed t test (a, c, d, e), or by two-way ANOVA, followed by Sidaks test (f), or by Scheirer-Ray-Hare Test (h). Source data are provided as a Source data file.

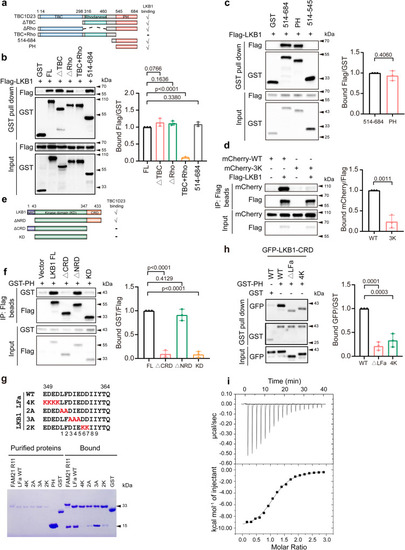
The PH domain of TBC1D23 directly interacts with LKB1

a Schematic diagram of full-length (FL) and various truncations of TBC1D23, and a summary of LKB1 binding determined by GST pull-down. b, c HEK293T cells were transfected with indicated constructs for 24 h. Cell lysates were subjected to precipitation with GST beads, and the bound proteins were immunoblotted with indicated antibodies. The graph showed ratios of bound Flag to GST quantified by densitometry using Image J software. d HEK293T cells were co-transfected with mCherry-TBC1D23 WT or 3 K and Flag-LKB1 for 24 h, and control cells were co-transfected with mCherry-TBC1D23 WT or 3 K and an empty vector. Cells were harvested and subjected to immunoprecipitation with anti-Flag beads followed by immunoblotting with indicated antibodies. The ratios of bound mCherry to Flag derived from a densitometric analysis of the blot were shown. e A schematic diagram of full-length (FL) and truncated mutants of LKB1, and a summary of TBC1D23 binding determined by immunoprecipitation. f HEK293T cells co-transfected with LKB1 FL or its truncations (vector as control) and GST-TBC1D23 PH were lysed and incubated with anti-Flag beads, the immunoprecipitates were then examined by immunoblotting. The graph showed ratios of bound GST to Flag quantified by densitometry using Image J software. g GST-FAM21-R11, GST-LKB1-LFa WT, mutants, or GST pull-down of purified TBC1D23 PH domain. h HEK293T cells were transfected with indicated constructs. 24 h later, cell lysates were precipitated with GST beads and immunoblotted with indicated antibodies. The graph showed ratios of bound GFP to GST quantified by densitometry using Image J software. i Isothermal titration calorimetry of an LKB1-LFa motif peptide (GADEDEDLFDIEDDIIYTQ) titrated into TBC1D23 PH domain. Top and bottom panels show raw and integrated heat from injections, respectively. Experiments in (ai) were performed in triplicate. Results are presented as mean ± SD. P values were determined by one-way ANOVA, followed by followed by Dunnett’s test (b, f, h), or by unpaired two-tailed t test (c, d). Source data are provided as a Source data file.

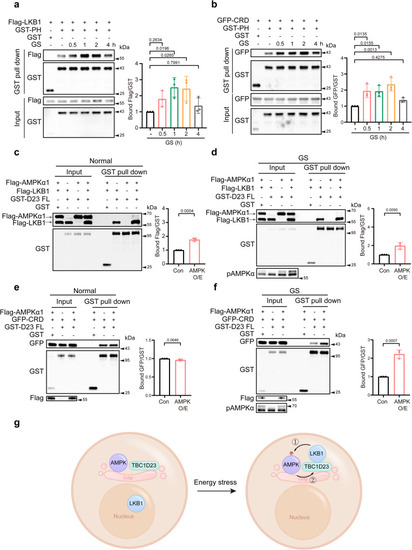
The interaction between TBC1D23 and LKB1 is dynamically regulated by AMPK activation.

a, b HEK293T cells were transfected with Flag-LKB1 (a) or GFP-LKB1 CRD (b) and GST-TBC1D23 PH, co-transfection of GST-vector and Flag-LKB1 (a) or GFP-LKB1 CRD (b) as the negative control. 24 h post-transfection, cell lysates were subjected to glucose starvation for indicated time and precipitation with GST beads, followed by immunoblotting with indicated antibodies. The graph showed ratios of bound Flag to GST (a) or GFP to GST (b) quantified by densitometry using Image J software. Values for each time point were shown relative to the ratio of control cells without glucose starvation. c, d HEK293T cells were transfected with indicated constructs. Twenty-four hours later, cells were treated with (d) or without (c) culture medium deprived of glucose for 2 h before harvest and precipitation with GST beads. Precipitates were resolved by SDS-PAGE and analyzed by western blotting. The graph showed ratios of bound Flag to GST quantified by densitometry using Image J software. e, f HEK293T cells were co-transfected with indicated constructs. Twenty-four hours later, cells were collected and subjected to pulldown with GST beads (e) or glucose-starvation for 2 h before harvest and pulldown with GST beads. Precipitates were resolved by SDS-PAGE and analyzed by western blotting with indicated antibodies. The graph showed ratios of bound GFP to GST quantified by densitometry using Image J software. n = 3 independent experiments (af). Results are presented as mean ± SD. P values were determined one-way ANOVA, followed by Dunnett’s test (a, b), or by unpaired two-tailed t test (cf). Con indicates co-transfection of Flag-LKB1 (c) or GFP-CRD (e) and GST-TBC1D23 FL. AMPK O/E indicates co-transfection of Flag-AMPKα1, Flag-LKB1 (d) or GFP-CRD (f), and GST-TBC1D23 FL. g A simplified model depicts the mechanism underlying the dynamic interaction between TBC1D23 and LKB1. Energy stress stimulates the TBC1D23/LKB1 interaction, which promotes the recruitment of LKB1 to the Golgi, which in turn promotes phosphorylation and activation of AMPK (①), and activated AMPK further facilitates the interaction between TBC1D23 and LKB1 (②). Source data are provided as a Source data file.

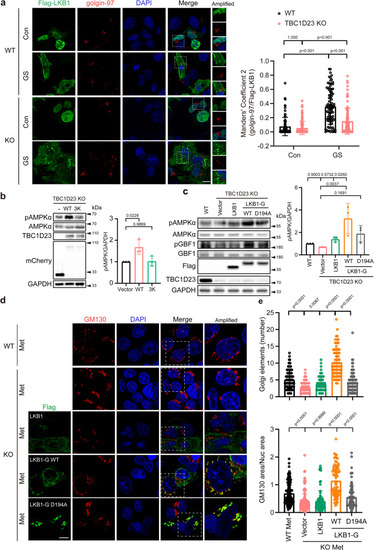
TBC1D23 and LKB1 cooperate to promote Golgi-AMPK activation.

a WT and TBC1D23 KO HepG2 cells were transiently transfected with Flag-LKB1 for 24 h and glucose starved for 2 h. Cells were stained with antibodies against Flag and golgin-97. Scale bar, 10 μm. Mander’s coefficient 2 (golgin-97 overlapping with Flag-LKB1) were graphed as mean ± SD. Each dot represents Mander’s coefficient from one cell. WT Con: n = 81; WT GS: n = 92; KO Con: n = 116; KO GS: n = 98. b TBC1D23 KO HEK293T cells were transiently transfected with mCherry-vector, mCherry-TBC1D23 WT or mCherry-TBC1D23 3 K mutant for 24 h. Cells were treated with a medium deprived of glucose for 2 h before harvest. Whole-cell lysates were analyzed by immunoblotting. The graph shows the levels of pAMPK quantified by densitometry using Image J software and normalized to GAPDH. c TBC1D23 KO HEK293T cells were transiently transfected with indicated constructs for 24 h, WT HEK293T cells as the control. Cells were treated with medium deprived of glucose for 2 h before harvest and immunoblotted with indicated antibodies. The graph shows the levels of pAMPK quantified by densitometry using Image J software and normalized to GAPDH. d Confocal micrographs of WT or TBC1D23 KO HepG2 cells expressing the indicated constructs were treated with metformin (Met, 10 mM, 4 h) and co-stained with antibodies against Flag and GM130. Scale bar, 10 μm. e Bar graph represents the quantitation of the Golgi disassembly. Each dot in the figure represents the number of Golgi elements from one cell (upper pannel); the ratio between the total area occupied by GM130 and the nucleus (DAPI) was also used to indicate Golgi disassembly (lower pannel). WT: n = 142; KO: n = 165; KO + LKB1: n = 88; KO + LKB1-G WT: n = 79; KO + LKB1-G D194A: n = 85. n indicates pooling cells from one replicate (a, d). Similar results were obtained in three independent experiments (ad). Results are presented as mean ± SD (ad), and p values were determined by Scheirer-Ray-Hare Test (a) or by one-way ANOVA, followed by Dunnett’s test (b, c), or by Kruskal–Wallis test (e). Source data are provided as a Source data file.

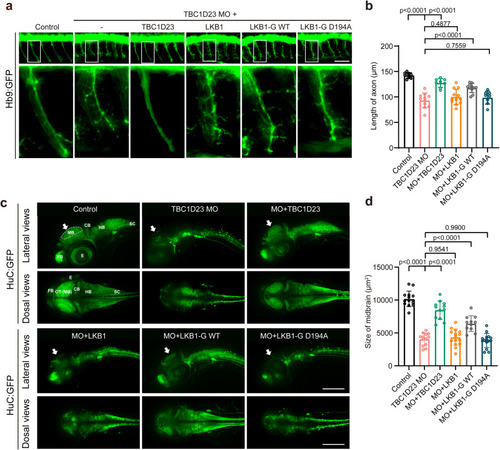
Golgi-targeted expression of LKB1 partially rescues TBC1D23 deficiency in zebrafish.

a Morphology of CaP axons in Tg[Hb9:GFP]ml2 transgenic zebrafish at 48 hpf with z-axis scanning, scale bar, 50 μm. Lateral views (upper) and enlarged views of rectangles (lower) are shown. b Statistical analysis of the length of CaP axons in zebrafish at 48 hpf. Approximately 8 to 12 Tg[Hb9:GFP] transgenic zebrafish embryos from each group were measured for 3 CaP axons at approximately the third to fifth CaP axon located on the yolk extension, with each point representing the average axon length of one embryo. Control, control morpholino (MO) injection (n = 10 embryos); TBC1D23-MO, TBC1D23-MO injection (n = 11 embryos); TBC1D23-MO + TBC1D23, TBC1D23-MO, and human TBC1D23 WT mRNA co-injection (n = 8 embryos); TBC1D23-MO + LKB1, TBC1D23-MO and human LKB1 WT mRNA co-injection (n = 12 embryos); TBC1D23-MO + LKB1-G WT, TBC1D23-MO, and LKB1-G WT mRNA co-injection (n = 11 embryos); TBC1D23-MO + LKB1-G D194A, TBC1D23-MO, and LKB1-G D194A mRNA co-injection (n = 8 embryos). All injections are performed at the one-cell stage of development. c HuC (green) expression in Tg[HuC:GFP] transgenic zebrafish at 48 hpf. The overview fluorescent images are presented as maximum intensity z-projections. White arrowheads point to the midbrain. FB, forebrain; MB, midbrain; OT, optic tectum; CB, cerebellum; HB, hindbrain; SC, spinal cord; E, eye. Top, lateral view; bottom, dorsal view, scale bar, 200 μm. d The size of zebrafish midbrain at 48 hpf. The size of the midbrain was measured from the lateral view, and 11 to 15 embryos from each group were used for comparison. Con: n = 14 embryos; TBC1D23 MO: n = 13 embryos; MO + TBC1D23: n = 12 embryos; MO + LKB1: n = 15 embryos; MO + LKB1-G WT: n = 11 embryos; MO + LKB1-G D194A: n = 15 embryos. Results are presented as mean ± SD. P values were calculated using one-way ANOVA, Dunnett’s multiple comparisons test (b, d). Experiments were repeated 3 times. Source data are provided as a Source data file.

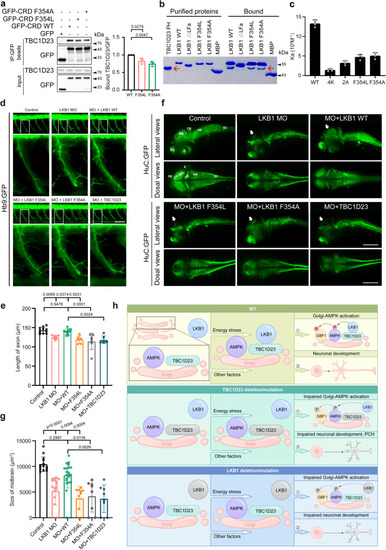
Interaction with TBC1D23 is required for LKB1 to promote neuronal development and brain growth.

a HEK293T cells were transfected with indicated constructs, and then immunoprecipitated with GFP beads and probed with indicated antibodies. The graph showed ratios of bound TBC1D23 to GFP quantified by densitometry. b MBP-LKB1 CRD-LFa WT, mutants, or MBP pull-down of purified GST-TBC1D23 PH domain. Red arrow indicates GST-TBC1D23 PH. c Affinity between TBC1D23 PH domain and LKB1-LFa WT or mutants, determined by ITC. Mean association constants (Ka) are shown, with error bars indicating SD from 3 independent titrations. d Morphology of CaP axons in Tg[Hb9:GFP]ml2 transgenic zebrafish at 48 hpf with z-axis scanning, scale bar, 50 μm. Lateral views (upper) and enlarged views of rectangles (lower) are shown. e Statistical analysis of the length of CaP axons in zebrafish at 48 hpf. Approximately 6 to 11 Tg[Hb9:GFP] transgenic zebrafish embryos from each group were measured for 3 CaP axons at approximately the third to fifth CaP axon located on the yolk extension, with each point representing the average axon length of one embryo. f HuC (green) expression in Tg[HuC:GFP] transgenic zebrafish at 48 hpf. Top, lateral view; bottom, dorsal view. scale bar, 200 μm. g The size of zebrafish midbrain at 48 hpf. The overview fluorescent images are presented as maximum intensity z-projections. White arrowheads point to the midbrain. FB, forebrain; MB, midbrain; OT, optic tectum; CB, cerebellum; HB, hindbrain; SC, spinal cord; E, eye. The size of the midbrain was measured from the lateral view, and 8 to 21 embryos from each group were used for comparison. Results are presented as mean ± SD (ag), and p values were calculated using one-way ANOVA, Dunnett’s multiple comparisons test (a and e) or by Kruskal–Wallis test (g). Experiments were repeated 3 times (ag). h Simplified model depicting how TBC1D23 and LKB1 cooperate to promote AMPK activation at Golgi and to regulate neuronal development. TBC1D23 mutation/deletion or LKB1 mutation/deletion impairs the recruitment of LKB1 to Golgi, leading to compromised Golgi-AMPK activation, aberrant neuronal development, and eventually pontocerebellar hypoplasia (PCH). Source data are provided as a Source data file.

Acknowledgments
This image is the copyrighted work of the attributed author or publisher, and ZFIN has permission only to display this image to its users. Additional permissions should be obtained from the applicable author or publisher of the image. Full text @ Nat. Commun.