IMAGE

Fig. 1

ID
ZDB-IMAGE-240229-162
Source
Figures for Tu et al., 2024
Image
Figure Caption

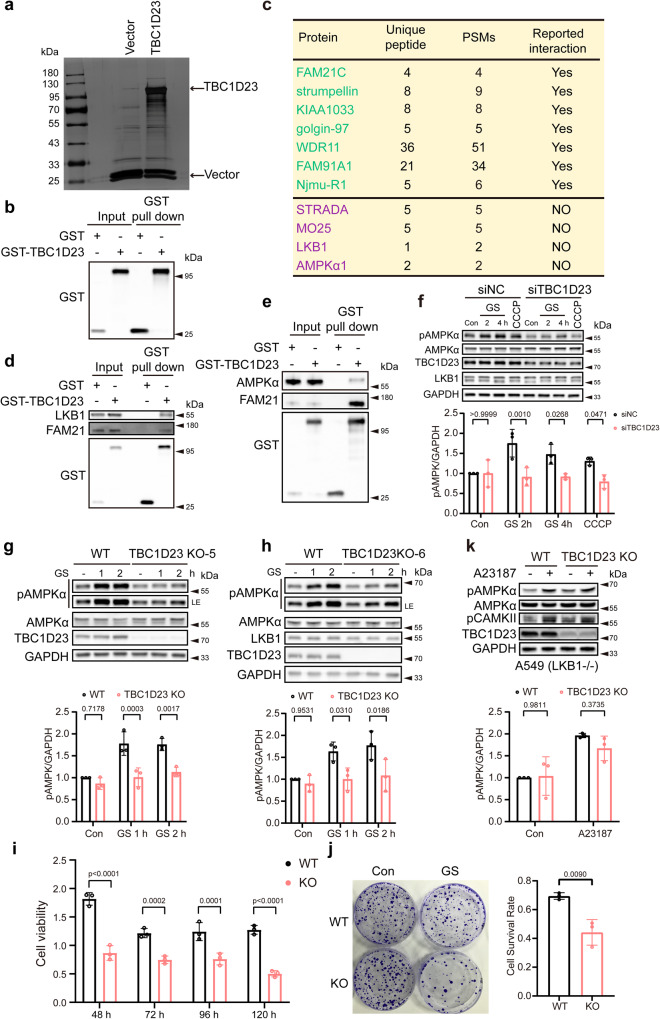
Fig. 1 TBC1D23 is an interactor of LKB1 and is required for stress-induced AMPK activation.

a Silver staining gel of proteins precipitated from HEK293T cells transfected with GST-TBC1D23 or GST-empty vector. Specific TBC1D23-interacting proteins were resolved by SDS-PAGE and silver staining, followed by mass spectrometry. b The enrichment of TBC1D23 is confirmed by western blotting and IP-MS data (Supplementary Data 1). c Partial list of proteins identified by mass spectrometry analysis. PSMs: peptide-to-spectrum matches. d, e HEK293T cells were transfected with GST-vector or GST-TBC1D23, followed by pull down assay with GST beads and immunoblotting with indicated antibodies. f HUVEC cells transduced with control siRNA or siTBC1D23 were subjected to glucose starvation (GS) for the indicated time, or treated with CCCP (20 μΜ, 4 h). g, h WT, TBC1D23 KO single clone KO-5 (g) and KO-6 (h) HepG2 cells glucose starved for the indicated time were lysed and subjected to immunoblotting. LE: long exposure. i, j WT or TBC1D23 KO HepG2 cells were glucose starved for 12 h, and cultured for the indicated time. The cell viability was normalized to that of 0 h (i).WT vs KO: 48 h, p value: 1.95e−008; 72 h, p value: 1.65e−004; 96 h, p value: 1.27e−004; 120 h, p value: 3.62e−007; WT and TBC1D23 KO HepG2 cells were subjected to glucose starvation for 12 h and cultured for 14 days, then stained by crystal violet. The number of colonies and cell survival rate were normalized to control cells without glucose starvation. Data are the mean of biological replicates from a representative experiment (j). k WT and TBC1D23 KO A549 cells were incubated with or without 2 μM A23187 for 30 min; cells were then lysed and analyzed by indicated antibodies. The graph shows the levels of pAMPK quantified by densitometry and normalized to GAPDH (f, g, h, k). Experiments were performed in triplicate (dk). Quantification data are the mean ± SD (fk), with p values calculated by two-way ANOVA, followed by Sidak’s test (f, g, h, i, k), or by unpaired two-tailed t test (j). Source data are provided as a Source data file.

Acknowledgments
This image is the copyrighted work of the attributed author or publisher, and ZFIN has permission only to display this image to its users. Additional permissions should be obtained from the applicable author or publisher of the image. Full text @ Nat. Commun.