IMAGE

Fig. 3

ID
ZDB-IMAGE-240229-164
Source
Figures for Tu et al., 2024
Image
Figure Caption

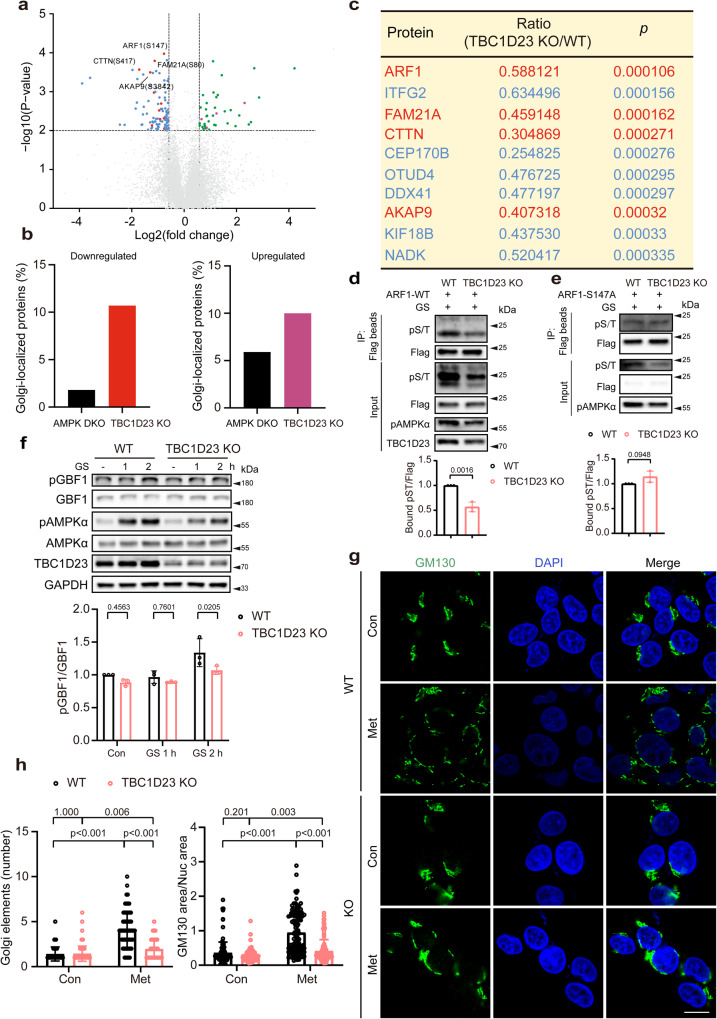
Fig. 3 TBC1D23 preferentially regulates the phosphorylation of Golgi-localized proteins, and TBC1D23 loss prevents Golgi disassembly.

a Volcano plot of quantitative analysis of phosphopeptides identified by MS. Blue or red: peptides with fold-change (TBC1D23 KO:WT) < 0.67 (p < 0.01, t-test); green or purple: peptides with fold-change (TBC1D23 KO:WT) > 1.5 (p < 0.01, t-test); red or purple: golgi-localized proteins; gray: no significant difference. b Combined analysis of phosphosites identified from AMPK DKO (AMPKα1/α2 double knockout) cells and TBC1D23 KO cells. The proportion of Golgi-localized proteins was determined. c Top 10 phosphosites with higher levels of phosphorylation in WT cells than TBC1D23 KO cells, ranked by p value. Golgi-localized proteins were shown in red color. d, e Constructs encoding Flag-tagged ARF1 WT (d) or S147A mutant (e) were transfected into WT or TBC1D23 KO HEK293T cells. 24 h later, cells glucose starved for 2 h were collected and subjected to immunoprecipitation using Flag beads and immunoblotting. The graph showed ratios of bound pST to Flag quantified by densitometry using Image J software. f WT and TBC1D23 KO HEK293T were glucose starved for the indicated time, and cell lysates were subjected to immunoblotting. The graph shows the levels of pGBF1 quantified by densitometry using Image J software and normalized to GBF1. g, h WT and TBC1D23 KO HepG2 cells were treated with or without 10 mM metformin for 4 h. The cells were stained with an anti-GM130 (Golgi marker) antibody. Representative confocal images (g) and quantitation of Golgi elements in cells as treated in (g) (h, left panel). Scale bar, 10 μm. The ratio between the total area occupied by GM130 and DAPI was also used to indicate Golgi disassembly (h, right pannel). Each dot in the figure represents the ratio GM130 area/nucleus area from one cell. Similar results were obtained in three independent experiments (dh). Results are presented as mean ± SD (dh). P values were determined by unpaired two-tailed t test (a, c, d, e), or by two-way ANOVA, followed by Sidaks test (f), or by Scheirer-Ray-Hare Test (h). Source data are provided as a Source data file.

Acknowledgments
This image is the copyrighted work of the attributed author or publisher, and ZFIN has permission only to display this image to its users. Additional permissions should be obtained from the applicable author or publisher of the image. Full text @ Nat. Commun.