|
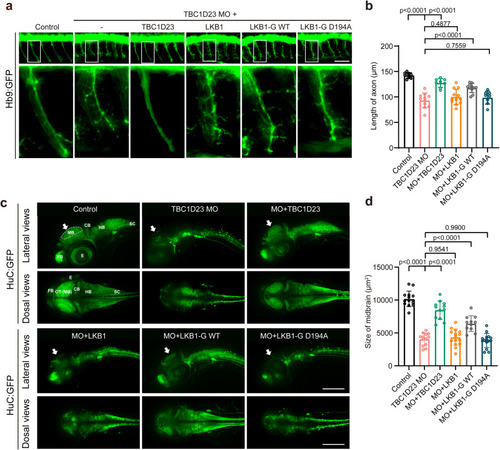
Golgi-targeted expression of LKB1 partially rescues TBC1D23 deficiency in zebrafish. a Morphology of CaP axons in Tg[Hb9:GFP]ml2 transgenic zebrafish at 48 hpf with z-axis scanning, scale bar, 50 μm. Lateral views (upper) and enlarged views of rectangles (lower) are shown. b Statistical analysis of the length of CaP axons in zebrafish at 48 hpf. Approximately 8 to 12 Tg[Hb9:GFP] transgenic zebrafish embryos from each group were measured for 3 CaP axons at approximately the third to fifth CaP axon located on the yolk extension, with each point representing the average axon length of one embryo. Control, control morpholino (MO) injection (n = 10 embryos); TBC1D23-MO, TBC1D23-MO injection (n = 11 embryos); TBC1D23-MO + TBC1D23, TBC1D23-MO, and human TBC1D23 WT mRNA co-injection (n = 8 embryos); TBC1D23-MO + LKB1, TBC1D23-MO and human LKB1 WT mRNA co-injection (n = 12 embryos); TBC1D23-MO + LKB1-G WT, TBC1D23-MO, and LKB1-G WT mRNA co-injection (n = 11 embryos); TBC1D23-MO + LKB1-G D194A, TBC1D23-MO, and LKB1-G D194A mRNA co-injection (n = 8 embryos). All injections are performed at the one-cell stage of development. c HuC (green) expression in Tg[HuC:GFP] transgenic zebrafish at 48 hpf. The overview fluorescent images are presented as maximum intensity z-projections. White arrowheads point to the midbrain. FB, forebrain; MB, midbrain; OT, optic tectum; CB, cerebellum; HB, hindbrain; SC, spinal cord; E, eye. Top, lateral view; bottom, dorsal view, scale bar, 200 μm. d The size of zebrafish midbrain at 48 hpf. The size of the midbrain was measured from the lateral view, and 11 to 15 embryos from each group were used for comparison. Con: n = 14 embryos; TBC1D23 MO: n = 13 embryos; MO + TBC1D23: n = 12 embryos; MO + LKB1: n = 15 embryos; MO + LKB1-G WT: n = 11 embryos; MO + LKB1-G D194A: n = 15 embryos. Results are presented as mean ± SD. P values were calculated using one-way ANOVA, Dunnett’s multiple comparisons test (b, d). Experiments were repeated 3 times. Source data are provided as a Source data file.
|

