IMAGE

Fig. 2

ID
ZDB-IMAGE-240229-163
Source
Figures for Tu et al., 2024
Image
Figure Caption

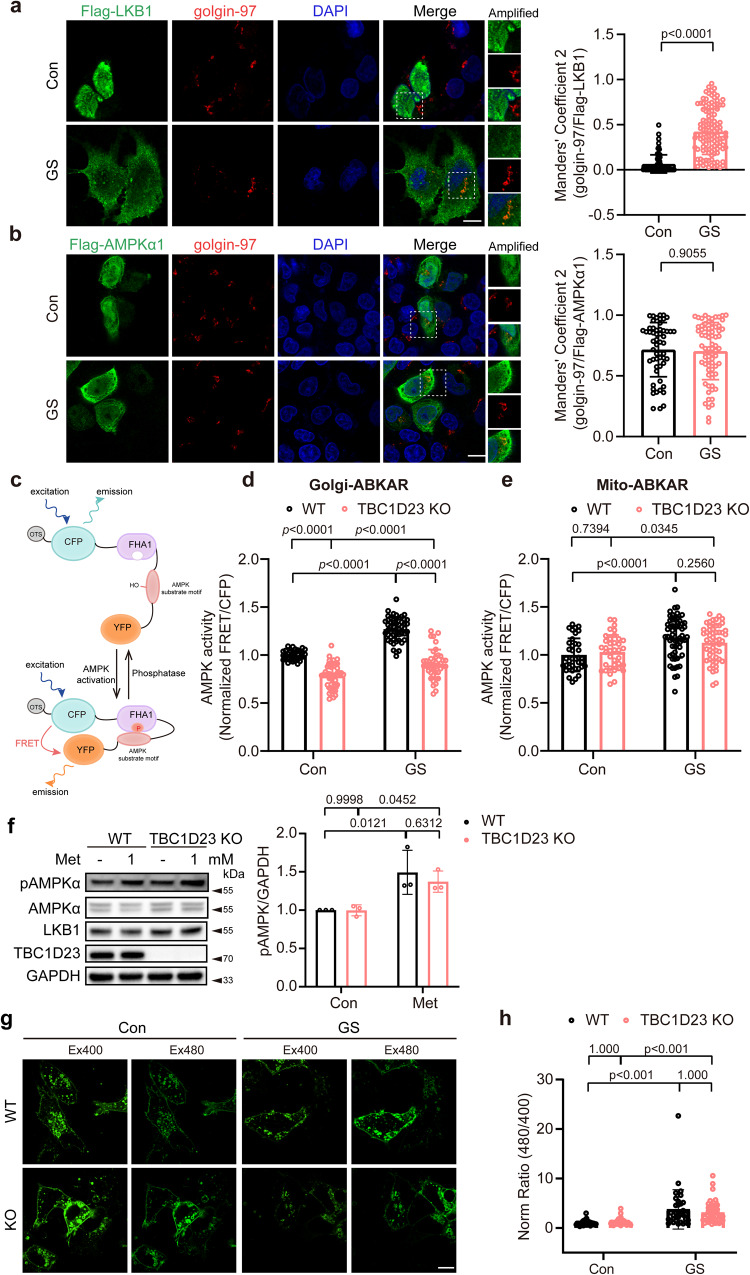
Fig. 2 Deletion of TBC1D23 specifically impairs Golgi-AMPK activation.

a HepG2 cells were transiently transfected with Flag-LKB1 for 24 h, and incubated with or without glucose-free medium for 2 h. Cells were stained with antibodies against Flag and golgin-97, a Golgi marker. Scale bar, 10 μm. Mander’s coefficient 2 (golgin-97 overlapping with Flag-LKB1) were graphed as mean ± SD. p value: 2.41e−030. b HepG2 cells transiently transfected with Flag-AMPKα1 were subjected to glucose starvation for 2 h. Scale bar, 10 μm. Mander’s coefficient 2 (golgin-97 overlapping with Flag-AMPKα1) were graphed as mean ± SD. Each dot represents Manders’ coefficients from one cell (a, b). c Schematic diagram of subcellular compartment-specific biosensor osABKAR. d, e WT and TBC1D23 KO HepG2 cells transiently transfected with Golgi-ABKAR (d) or Mito-ABKAR (e) were incubated with glucose-free medium for 2 h and 4 h, respectively. The FRET/CFP ratio of WT cells incubated with DMEM was set as 1, and FRET/CFP ratio of other groups was normalized to WT cells incubated with DMEM. d WT Con vs KO Con: p value: 1.47e−011; WT GS vs KO GS: p value: 0.00e + 000; WT Con vs WT GS: p value: 0.00e + 000; KO Con vs KO GS, p value: 4.07e−005. e WT Con vs WT GS: p value: 1.91e−005. f WT and TBC1D23 KO HepG2 cells were treated with or without 1 mM metformin for 2 h. Cells lysates were analyzed by immunoblotting. The graph shows the levels of pAMPK quantified by densitometry using Image J software and normalized to GAPDH. g, h WT and TBC1D23 KO HepG2 cells transiently transfected with Lyso-ExRai-AMPKAR for 24 h were incubated with or without glucose-free medium for 2 h. Representative images (g) and statistical analysis (h) of Lyso-AMPK activity measured by Lyso-ExRai-AMPKAR. Scale bar, 10 μm. Similar results were obtained in three independent experiments (ah). ah Statistical data are presented as mean ± SD. P values were determined by unpaired two-tailed Mann–Whitney test (a, b), or by two-way ANOVA, followed by Sidak’s test (df), or by Scheirer-Ray-Hare Test (h). Source data are provided as a Source data file.

Acknowledgments
This image is the copyrighted work of the attributed author or publisher, and ZFIN has permission only to display this image to its users. Additional permissions should be obtained from the applicable author or publisher of the image. Full text @ Nat. Commun.