FIGURE SUMMARY
Title

Compartmentalization and synergy of osteoblasts drive bone formation in the regenerating fin

Authors
Cudak, N., López-Delgado, A.C., Rost, F., Kurth, T., Lesche, M., Reinhardt, S., Dahl, A., Rulands, S., Knopf, F.
Source
Full text @ iScience

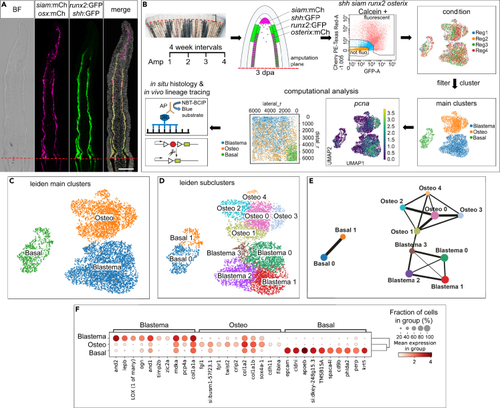
Experimental approach, the response to repeated amputation, cell clustering, and trajectory analysis

(A) 3 dpa fin cryosection of quadruple transgenic reporter zebrafish. BF, bright field, mCh, mCherry, osx, osterix. Scale bar 100 μm.

(B) Study design. Reg, regeneration experiment. Blastema, (non-osteoblast) blastema cells, Osteo, Osteoblasts, Basal, BLWE. Spatial reconstruction (pseudospace analysis): distal_r, pseudospace coordinate distal dimension, lateral_r, pseudospace coordinate lateral dimension. AP, alkaline phosphatase coupled antibody, DIG, digoxygenin, NBT, nitro blue tetrazolium, BCIP, 5-bromo-4-chloro-3-indolyl-phosphate.

(C) Main clusters identified in the analysis. Basal, BLWE, Blastema, (non-osteoblast) blastema cells, Osteo, osteoblasts.

(D) Identified subclusters.

(E) PAGA analysis displaying connectivity (reflected by line thickness) between different clusters.

(F) Marker gene expression in main clusters.

Phenotypic diversity and location of (non-osteoblast) blastema cells and osteoblasts

(A) zic2a and timp2b expression.

(B) postna in Blastema0. postna absence in osteoblasts and DMB.

(C) LOX (1 of many) expression in Blastema1, touching the BLWE.

(D) mustn1a expression.

(E) mfap5 expression in Blastema3 and some osteoblasts.

(F) fgl1 and spon1b expression.

(G) twist2 expression in Osteo0 cells.

(H) Non-exclusive lum expression in Osteo1.

(I) ifitm5 expression.

(J) Topology scheme of the 3 dpa regenerate, with vague distinction between Blastema0, 1, and 3. (A)–(I) UMAP, whole-mount RNA ISH (WMISH) and cryosection views. Scale bars whole mounts 100 μm, cryosections 50 μm, insets 10 μm.
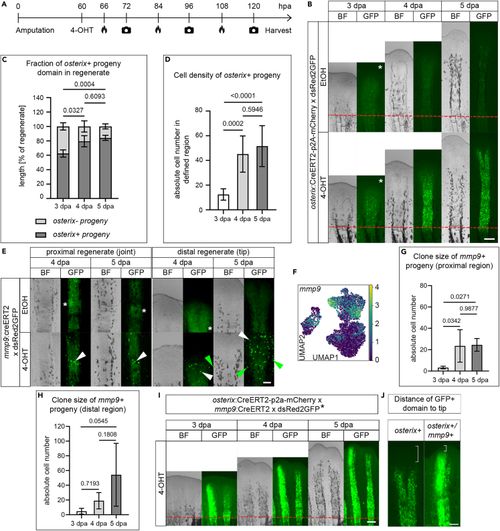
Lineage tracing of osterix+ and mmp9+ osteoblasts

(A) Experimental design. 4-OHT, 4-hydroxytamoxifen. Flame icon, heat induction. Camera icon, imaging.

(B) Lineage tracing of osterix+ cells. Asterisk, brightness and contrast increased to reveal GFP expression. Scale bar 200 μm.

(C) Fraction of osterix+ and osterix− progeny at 3, 4, and 5 dpa. Kruskal-Wallis.

(D) Density of osterix+ progeny in the 3, 4, and 5 dpa regenerate in a defined square region of interest (fin ray regenerate region close to amputation plane) of 0.028 mm2 (167 μm × 167 μm). One-way Anova (Tukey).

(E) Lineage tracing of mmp9+ cells (joint cells in proximal regenerate [arrowhead], left panel, and cells in distal regenerate, right panel). Scale bar 100 μm. Asterisks indicate autofluorescence. White arrowheads, nGFP+ cells within fin ray region, green arrowheads, nGFP+ cells in interray.

(F) UMAP view of mmp9 expression. Expression is not restricted to joint cells.

(G) Clone size of mmp9+ progeny in the proximal region of the regenerate. One-way Anova (Tukey).

(H) Variable clone size of mmp9+ progeny in the distal region of the regenerate. One-way Anova (Tukey).

(I) Lineage tracing of osterix+ and mmp9+ cells. dsRed2GFP∗, hsp70L:R2nlsGFP x Actb:dsRed2GFP. Scale bar 200 μm.

(J) Magnified view of osterix+ progeny shown in (B) and osterix+/mmp9+ progeny shown in (I). Brackets, distance to the tip of the regenerate. Scale bar 100 μm. (B), (E) EtOH, ethanol vehicle control. (B), (I) Red dashed line, amputation plane. (B), (E), (I) BF, bright field. (C), (D), (G), (H) Mean ± SD.

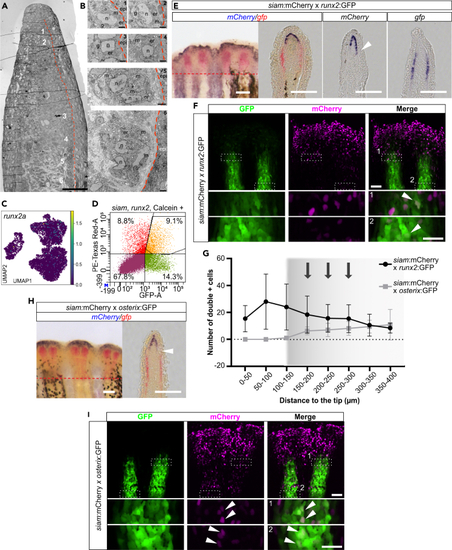
Mixing of distal blastema cells and osteoblasts

(A) Overview of TEM of regenerate with positions of cells of interest indicated (1–6). Red dashed line, subepithelial basal lamina.

(B) Cells underlying the BLWE with gradual increase of endoplasmic reticulum (er) from distal (1,2) via intermediate (3,4) to proximal positions. More dilated ER in proximal regions with more Golgi complexes (g) and mitochondria (m) suggesting massive protein synthesis. See also Figure S7. epi, epidermis. n, nucleus. Scale bar (A) 50 μm, (B) 2 μm.

(C) UMAP of runx2a.

(D) FACS gates to identify siam:mCherry+, osterix:GFP+, and mCherry/GFP double+ cells at 3 dpa with respective percentages of unlabeled and labeled cell populations.

(E) Single and double ISH of mCherry and gfp transcripts in siam:mCherry x runx2:GFP transgenic zebrafish. Arrowhead, proximal mCherry expression. Red dashed line, amputation plane. Scale bars 100 μm.

(F) Detection of mCherry/GFP protein double+ cells (arrowheads in boxed areas) in 3 dpa fin regenerates of siam:mCherry x runx2:GFP transgenic zebrafish. Scale bar overview 50 μm. Scale bar inset 25 μm.

(G) Quantification of mCherry, GFP double+ cells in siam:mCherry x runx2:GFP, and siam:mCherry x osterix:GFP transgenic zebrafish (experiments shown in [F], [I]). Shadowed interval with arrows, regions outside of transcript detection.

(H) Double ISH of mCherry and gfp transcripts in siam:mCherry x osterix:GFP transgenic zebrafish. Arrowhead, transcript negative region. Red dashed line, amputation plane. Scale bars 100 μm.

(I) Detection of mCherry/GFP protein double+ cells in 3 dpa siam:mCherry x osterix:GFP fin regenerates (arrowheads in boxed areas). Scale bar overview 50 μm. Scale bar inset 25 μm. (G) Mean ± SD.

Effects of SU5402 on different regenerate domains

(A) Treatment regimen.

(B) 5 dpa fin regenerates of siam:mCherry x osterix:GFP transgenic zebrafish treated with SU5402 or DMSO from 3 to 5 dpa. White arrowhead, reduced regenerate length.

(C) Quantification of experiment shown in (B). Welch’s t tests.

(D) 7 dpa fin regenerates of siam:mCherry x osterix:GFP transgenic zebrafish treated with SU5402 or DMSO from 3 to 5 dpa and 2 days recovery (5–7 dpa). Brackets, siam+ tip region.

(E) Quantification of experiment shown in (D). Welch’s t tests.

(F) Fluorescence signal intensity of transgenic reporters along fin regenerate. Arrowheads, increased signal intensity. (B), (D) Scale bars 200 μm. (C), (E) Mean, (F) Mean ± SEM.

Effects of mmp9+ and osterix+ cell ablation on fin regeneration

(A) 5 dpa fin regenerates of 3–5 dpa NFP-treated fin regenerates of mmp9:NTR, osterix:NTR, osterix:NTR x mmp9:NTR sibling zebrafish and osterix:CreERT2mCherry zebrafish, respectively. Fluorophore view images in high brightness and contrast settings (asterisks) to reveal dying cells in NTR+ zebrafish (same adjustments for osterix:CreERT2mCherry). White arrowhead, reduced regenerate length, black arrowheads, segment joints, black arrow, incomplete segment joint.

(B) Quantification of experiment shown in (A). One-way Anova (Tukey), excluding osterix:CreERT2 (non-sibling).

(C) IHC sections of NFP and BrdU treated 5 dpa osterix:mCherry and osterix:NTR x mmp9:NTR zebrafish fin regenerates. Arrowhead, BrdU+ cells in distal regenerate.

(D) Quantification of experiment shown in (C). Kruskal-Wallis. Epid, epidermis, Mes, mesenchyme, dist., 0–250 μm from regenerate tip, prox., 250 μm from regenerate tip to amp plane.

(E) Recovery treatment regimen.

(F) 5 and 7 dpa fin regenerates of 3–5 dpa NFP treated fin regenerates of osterix:NTR x mmp9:NTR zebrafish (DMSO treatment during recovery).

(G) Increase in regenerate length in mmp9:NTR, osterix:NTR, osterix:NTR x mmp9:NTR, and osterix:mCherry zebrafish during 2 days recovery (DMSO treatments). Dunnett’s T3, excluding osterix:mCherry (non-sibling).

(H) DMSO and SU5402 recovery treated 7 dpa fin regenerates of osterix:NTR x mmp9:NTR and osterix:mCherry zebrafish. Scale bars (A, F, H) 200 μm, (C) 20 μm. (B), (D), (G) Mean ± SD.

Structural integrity and establishment of segment joints are impaired after osterix+ cell ablation

(A) 7 dpa fin regenerates of 3–5 dpa NFP treated runx2:GFP x osterix:NTR zebrafish. Arrowhead, accumulated melanocytes.

(B) Regenerate length and domain sizes (proximal vs. distal to bifurcation, runx2:GFP negative tip region) at 5 dpa after NFP treatment. Welch’s t tests, Mann-Whitney test for tip region. p(§, tip region) = 0.7732, p($, dist. runx2:GFP) = 0.2564, p(#, prox. runx2:GFP) = 0.6341.

(C) Regenerate length and domain sizes at 7 dpa, after 2days recovery. Welch’s t tests. p(§, tip region) = 0.0624, p($, dist. runx2:GFP) = 0.7599, p(#, prox. runx2:GFP) = 0.0100.

(D) 5 dpa fin regenerates of 3–5 dpa DMSO and NFP treated mmp9:GFP x osterix:NTR zebrafish. Black and green arrowheads, segment joints.

(E) 7 dpa fin regenerates of 3–5 dpa DMSO and NFP treated mmp9:GFP x osterix:NTR zebrafish (2 days recovery). Arrowheads, segment joints.

(F) 5 dpa anti-chondroitin sulfate (CS) and anti-Laminin stained runx2:GFP x osterix:NTR fin regenerate sections after NFP treatment. Arrowheads, Laminin and CS signal in non-ablated fins. Red signal in ablated fins, dying osterix+ cells. Scale bars (A, D, E) 200 μm, (F) 50 μm. (B), (C) Mean.

Acknowledgments
This image is the copyrighted work of the attributed author or publisher, and ZFIN has permission only to display this image to its users. Additional permissions should be obtained from the applicable author or publisher of the image. Full text @ iScience