FIGURE SUMMARY
Title

Canonical Wnt and TGF-β/BMP signaling enhance melanocyte regeneration but suppress invasiveness, migration, and proliferation of melanoma cells

Authors
Katkat, E., Demirci, Y., Heger, G., Karagulle, D., Papatheodorou, I., Brazma, A., Ozhan, G.
Source
Full text @ Front Cell Dev Biol

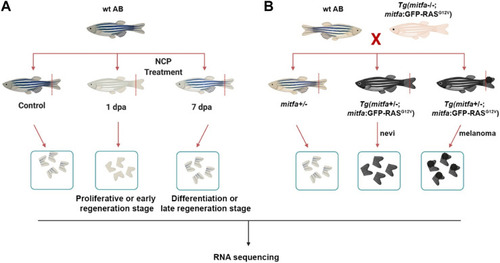
Generation of the zebrafish models of melanocyte regeneration and melanoma (A) Following neocuproine (NCP) treatment, caudal fins of individual zebrafish were collected for each group (control, 1 dpa = proliferative or early regeneration stage, and 7 dpa = differentiation or late regeneration stage) and used as biological replicates (no pooling). (B) The zebrafish melanoma model was generated by outcrossing the Tg(mitfa:Hsa.HRASG12V,mitfa:GFP) line with the wild-type (wt) AB zebrafish. 50% of the siblings (mitfa+/−) were used as the control group. 50% of the siblings Tg (mitfa+/−,HRASG12V:GFP) were used to collect the nevi and melanoma tissues. Caudal fins were collected for each group and used as biological replicates (no pooling). dpa: days post-ablation.

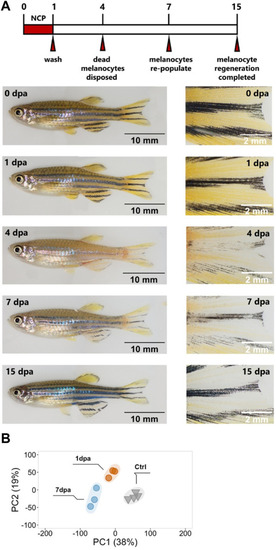
Validation of the melanocyte regeneration model and quantitative analysis of the DEGs at the proliferation and differentiation stages (A) Zebrafish melanocyte regeneration within 15 days after 1 day of neocuproine (NCP) treatment. Control zebrafish with standard stripe patterns on the body, including the caudal fin, before NCP treatment (0 dpa). Melanocytes were lost gradually, starting at 1 dpa, and extruded out of the skin at 4 dpa when the stripe pattern was not visible anymore. Melanocytes started to become visible at 7 dpa. At 15 dpa, melanocyte regeneration was completed, and the stripe pattern was re-established. Scale bars are 5 mm (whole fish on the left) and 2 mm (close-ups on the right). (B) Principal component analysis (PCA) of proliferative (1 dpa) and differentiation (7 dpa) stages of melanocyte regeneration and their controls. Different colors of dots and triangles represent the sample condition. Three sample groups were well clustered among their replicates and separated from other sample groups. Principal Component 1 (PC1, x-axis) represents 38%, and PC2 (y-axis) represents 19% of the total variation in the data. dpa, days post-ablation; ctrl, control; PC, principal component.

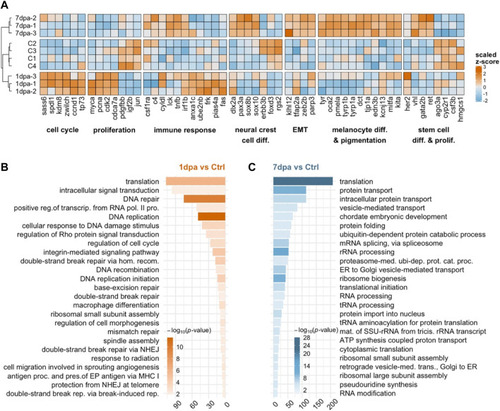
Early/proliferative and late/differentiation stages of melanocyte regeneration have distinct transcriptional profiles (A) The heatmap shows the relative expression of selected genes between proliferation (1 dpa) and differentiation (7 dpa) stages together with the control (C) group. Each column represents a single gene, and each row represents a biological replicate of each condition. The scale bar shows z-scores of variance-stabilized (vst-transformed) counts from high to low expression, represented by the color gradient from orange to blue, respectively. (B,C) DAVID was used to show the 25 most significantly enriched GO-BP terms based on the transcriptional changes in 1 dpa and 7 dpa comparisons. The color scale shows -log10 of the EASE p-value, and the x-axis shows the number of genes in each GO-BP term. dpa, days post-ablation, DAVID, Database for Annotation, Visualization, and Integrated Discovery, GO, Gene ontology, BP, Biological process. EMT, epithelial-to-mesenchymal transition; ctrl, control.

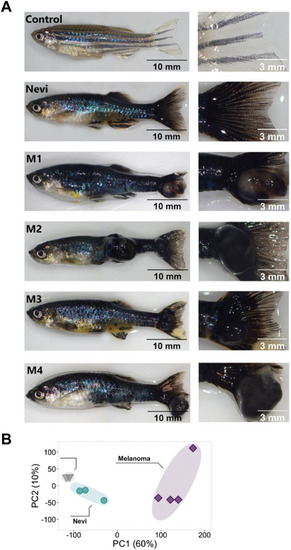
Validation of the melanoma model and quantitative analysis of the DEGs at the nevi and melanoma stages (A) Zebrafish nevi and melanoma (M1-M4) models. The whole fish are shown on the left, and their caudal fins used to collect the nevi and melanoma tissue are shown on the right. For melanoma samples, nodular melanoma samples were selected. Tissue materials were collected from the caudal fins of four individuals for each group and used as biological replicates (no pooling). Scale bars are 10 mm (whole fish on the left) and 3 mm (close-ups on the right). (B) Principal component analysis (PCA) of nevi, melanoma, and their controls. Different colors of dots and triangles represent the sample condition. Three sample groups were well clustered among their replicates and separated from other sample groups. Principal Component 1 (PC1, x-axis) represents 60%, and PC2 (y-axis) represents 10% of the total variation in the data. PC, principal component.

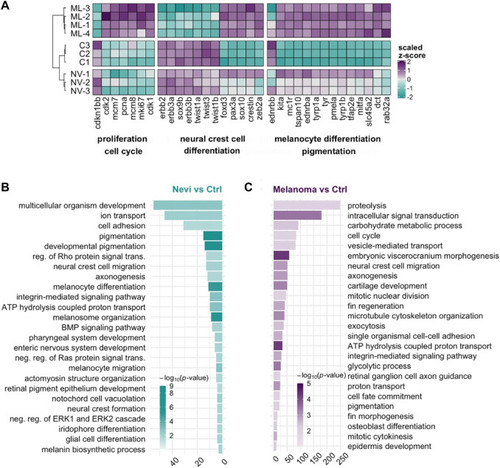
Transcriptional profile of melanoma differs from that of nevi by the proliferative burst and oppositely regulated NCC signature (A) The heatmap shows the relative expression of selected genes between nevi (NV) and melanoma (ML) stages together with the control (C) group. Each column represents a single gene, and each row represents a biological replicate of each condition. The scale bar shows z-scores of vst-transformed counts from high to low expression, represented by a color gradient from purple to turquoise, respectively. (B,C) DAVID was used to show the 25 most significantly enriched GO-BP terms based on the transcriptional changes in nevi and melanoma comparisons. The color scale shows -log10 of the EASE p-value, and the x-axis shows the number of genes in each GO-BP term. DAVID, Database for Annotation, Visualization, and Integrated Discovery, GO, Gene ontology, BP, Biological process.

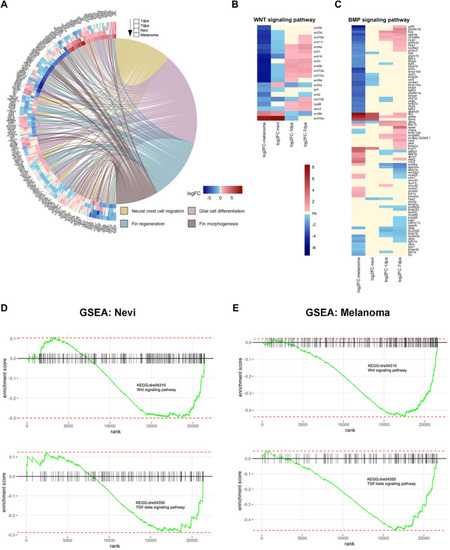
Cellular processes, including Wnt and TGF-β/BMP signaling pathways, are differentially regulated between melanocyte regeneration and melanoma (A) GOChord plot shows log2 fold changes of the genes annotated in selected GO-BP terms for two stages of the melanocyte regeneration, nevi, and melanoma. The genes are linked to their assigned pathways by ribbons and ordered according to their log2 fold change values from low to high regulation, represented by a color gradient from blue to red, respectively. log2 fold changes are shown from the outer to the inner annulus in the following order, 1 dpa, 7 dpa, nevi, and melanoma. Blue dotted circles show clusters of DEGs that are oppositely regulated between 1 dpa/7 dpa and nevi/melanoma. Red dotted circles show clusters of DEGs that are oppositely regulated between 7 dpa and nevi/melanoma. (B,C) Heatmaps of selected genes in Wnt and BMP signaling pathways. Genes and conditions are clustered by the similarity of their differential expression profiles (log2 fold change). log2 fold change values are represented from high to low regulation by a color gradient from red to blue. Beige color represents non-significant differential expression (FC < 1.2 in both directions or FDR>0.1). (D) Gene Set Enrichment Analysis (GSEA) plots of Wnt and TGF-β signaling pathways for zebrafish nevi samples. (E) GSEA plots of Wnt and TGF-β signaling pathways for zebrafish melanoma samples. GSEA was performed, and enrichment plots were generated for selected gene sets using the fgsea package. On each enrichment plot, the horizontal black line represents the p-value ranks of genes with the most significant p-value rank on the left. The vertical black bars represent individual genes in the gene set and their ranks. The green curves represent the cumulative enrichment score (ES), and the red horizontal dashed lines show minimal and maximal scores. dpa, days post-ablation.

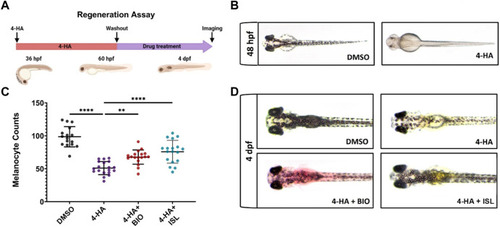
Activation of canonical Wnt or TGF-β/BMP signaling pathways enhances larval melanocyte regeneration (A) Scheme for experimental design of melanocyte regeneration. Zebrafish embryos were treated with 4-HA from 36 hpf to 60 hpf. After washout of 4-HA at 60 hpf, drugs were administered into the embryo water, and larvae were analyzed at 4 dpf. (B) 2 dpf zebrafish larvae treated with DMSO or 4-HA. (C) Dot plot showing the number of melanocytes in 4 dpf larvae treated with DMSO, 4-HA, 4-HA + BIO, or 4-HA + ISL. Each dot represents one larva (DMSO n = 16, 4-HA n = 19, 4-HA + BIO n = 18, 4-HA + ISL n = 17). Statistical significance was evaluated using a one-way ANOVA test **p < 0.01 and ****p < 0.0001. (D) Representative images of melanocyte regeneration groups are counted in (C). 4-HA, 4-Hydroxyanisole; DMSO, dimethyl sulfoxide; hpf, hours post-fertilization; dpf, days post-fertilization; ISL, isoliquiritigenin.

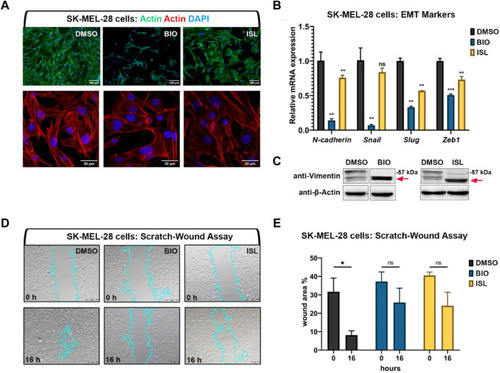
Activation of canonical Wnt or TGF-β/BMP signaling pathways suppresses invasiveness of human melanoma cells (A) Phalloidin staining in SK-MEL-28 melanoma cell line treated with BIO or ISL reveals changes in actin stress fiber formation. (B) qPCR on SKMEL-28 cells treated with BIO or ISL showing expression of EMT marker genes N-cadherin, Snail, Slug, and Zeb1. GAPDH was used as the housekeeping control gene. Error bars represent ±standard error of the mean (SEM, n = 3). Statistical significance was evaluated using an unpaired t-test. **p < 0.01, ***p < 0.001 and ns, nonsignificant. (C) Western blot of SKMEL-28 cells treated with BIO or ISL for the mesenchymal marker vimentin. Red arrow indicates cleaved vimentin. (D) Scratch-wound assay in SKMEL-28 cells treated with BIO or ISL. (E) Wound closure is the percentage of the remaining area not covered by the cells 16 h after the scratch. Error bars represent ±standard error of the mean (SEM, n = 3). Statistical significance was evaluated using an unpaired t-test. *p < 0.05, **p < 0.01, ***p < 0.001 and ns, non-significant. DMSO, dimethyl sulfoxide; ISL, isoliquiritigenin; EMT, epithelial-to-mesenchymal transition.

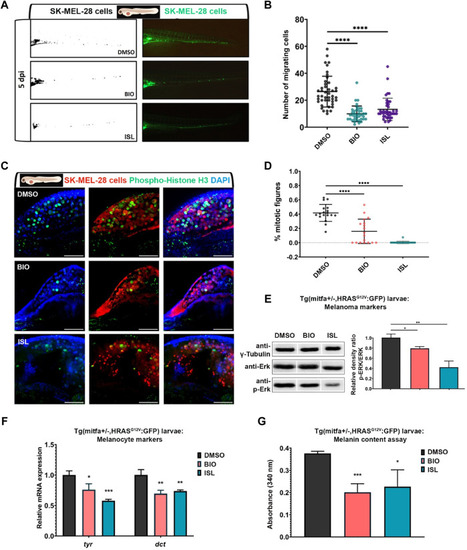
Activation of canonical Wnt or TGF-β/BMP signaling pathways suppresses migration and proliferation of human melanoma cells in vivo(A) Representative fluorescence microscope images of 7 dpf zebrafish larvae xenografted with human melanoma cells (SK-MEL-28) labeled with DiO (pseudo-color green) at 2 dpf and treated with DMSO, BIO or ISL. (B) Dot plot showing the number of invading cells at 7 dpf larval xenografts with micrometastasis. Each dot represents one larval xenograft (DMSO n = 44, BIO n = 38, ISL n = 41). (C) Representative confocal microscope images of anti-phospho-histone H3 (green) staining of 7 dpf zebrafish larvae xenografted with SK-MEL-28 cells (red) at 2 dpf and treated with DMSO, BIO, or ISL. (D) Dot plot showing the percentage of mitotic figures in each treatment. Each dot represents mitotic figures counted in each z-stack slice divided by the number of DiO + DAPI + nuclei in (C). Larvae were counterstained for DAPI. Scale bars are 50 μm. Statistical significance in B and D was evaluated using a one-way ANOVA test ****p < 0.0001. (E) Western blot of 5 dpf Tg(mitfa+/−,HRASG12V:GFP) zebrafish larvae treated with BIO or ISL for total and phospho-ERK (p-ERK). Tg (mitfa+/−) larvae were used as control. Graph shows the average relative density ratios of p-ERK to total ERK from three independent experiments. (F) qPCR on Tg(mitfa+/−,HRASG12V:GFP) zebrafish larvae treated with BIO or ISL showed reduced pigmentation marker genes tyr and dct expression at 5 dpf. Tg (mitfa+/−) larvae were used as control. rpl13 was used as the housekeeping control gene. (G) Melanin content of Tg(mitfa+/−,HRASG12V:GFP) zebrafish larvae treated with BIO or ISL. Error bars represent ±standard error of the mean (SEM, n = 6). Statistical significance was evaluated using an unpaired t-test. *p ≤ 0.05, **p ≤ 0.01 and ***p ≤ 0.001. DMSO, dimethyl sulfoxide; ISL, isoliquiritigenin; dpi, days post-injection; tyr, tyrosinase; dct, dopachrome tautomerase.

Acknowledgments
This image is the copyrighted work of the attributed author or publisher, and ZFIN has permission only to display this image to its users. Additional permissions should be obtained from the applicable author or publisher of the image. Full text @ Front Cell Dev Biol