IMAGE

FIGURE 3

ID
ZDB-IMAGE-231130-35
Source
Figures for Katkat et al., 2023
Image
Figure Caption

FIGURE 3

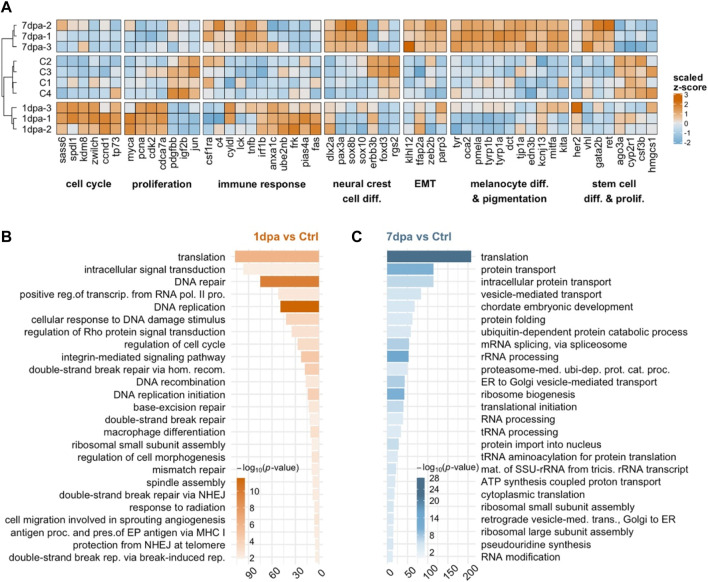
Early/proliferative and late/differentiation stages of melanocyte regeneration have distinct transcriptional profiles (A) The heatmap shows the relative expression of selected genes between proliferation (1 dpa) and differentiation (7 dpa) stages together with the control (C) group. Each column represents a single gene, and each row represents a biological replicate of each condition. The scale bar shows z-scores of variance-stabilized (vst-transformed) counts from high to low expression, represented by the color gradient from orange to blue, respectively. (B,C) DAVID was used to show the 25 most significantly enriched GO-BP terms based on the transcriptional changes in 1 dpa and 7 dpa comparisons. The color scale shows -log10 of the EASE p-value, and the x-axis shows the number of genes in each GO-BP term. dpa, days post-ablation, DAVID, Database for Annotation, Visualization, and Integrated Discovery, GO, Gene ontology, BP, Biological process. EMT, epithelial-to-mesenchymal transition; ctrl, control.

Acknowledgments
This image is the copyrighted work of the attributed author or publisher, and ZFIN has permission only to display this image to its users. Additional permissions should be obtained from the applicable author or publisher of the image. Full text @ Front Cell Dev Biol