
- Title
-
Multi-omics analysis of zebrafish response to tick saliva reveals biological processes associated with alpha-Gal syndrome
- Authors
- Vaz-Rodrigues, R., Mazuecos, L., Villar, M., Contreras, M., Artigas-Jerónimo, S., González-García, A., Gortázar, C., de la Fuente, J.
- Source
- Full text @ Biomed. Pharmacother.
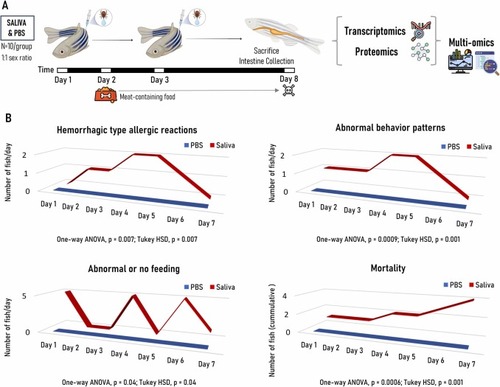
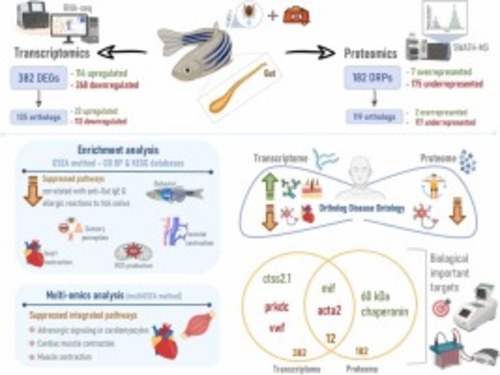
Experimental design and characterization of allergic reactions to tick saliva and mammalian meat consumption in the zebrafish model. (A) Zebrafish were intramuscularly inoculated with Ixodes ricinus tick saliva or PBS as negative control. Wild type adult AB strain zebrafish (10 animals/group; 1:1 female to male ratio) were kept on fish feed during pre-treatment and until Day 2. Zebrafish were injected with each treatment at Days 0 and 3, and from Day 2 and until the end of the experiment at Day 8 fish were fed with dog food containing mammalian meat. After fish euthanasia, intestine tissue samples were collected and used for transcriptomics and proteomics analyses with multi-omics integration of obtained datasets. (B) Zebrafish hemorrhagic type allergic reactions, abnormal behavior patterns, abnormal or no feeding and accumulated mortality were examined from Day 1 and followed daily until the end of the experiment at Day 8. Results were compared between treatments by one-way ANOVA test with post-hoc Tukey HSD test (p ≤ 0.05; N = 6–10 biological replicates). |
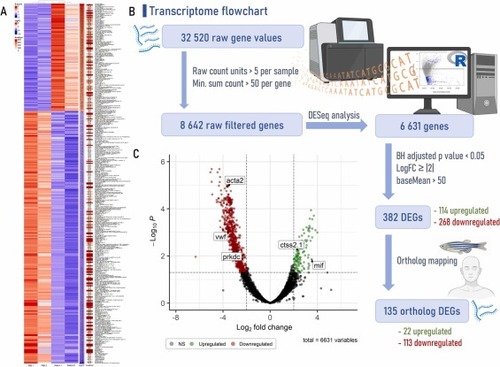
Transcriptome pipeline and visual representation of gene expression from gut zebrafish underlying the effects of tick saliva followed by mammalian meat consumption. (A) Heatmap with the differentially expressed genes (DEGs) created using the ComplexHeatmap package and the Heatmap function from R software, version 4.2.3, combining data from normalized Z-score values (Z-score), log2FoldChange (logFC) and average overall expression level (baseMean or AveExpr). (B) Flowchart that leads to the acquisition of DEGs and ortholog DEGs. First step includes raw count units based on a minimum of 5 counts/sample and a minimum sum threshold of 50 counts/gene across all samples. Second step is the differential expression analysis for sequence data (DESeq), performed with Bioconductor (version 3.16) DESeq2 package [47] from R. Third step allows to extract DEGs based on a Benjamini-Hochberg (BH) adjusted p-value cutoff < 0.05, a logFC ≥ |2| and a baseMean > 50. Last step is ortholog mapping that utilizes the convert_othologs function from the orthogene package employed with the gprofiler method and the drop_both_species feature, allowing to obtain highly concordant biological 1:1 orthologs genes between zebrafish (Danio rerio – input species) and human (Homo sapiens – output species). (C) Volcano plot, highlighting DEGs of interest, created with the EnhancedVolcano package. acta2: smooth muscle alpha-actin; ctss2.1: cathepsin S; mif: macrophage migration inhibitory factor; prkdc: DNA-dependent protein kinase; vwf: von Willebrand factor. |
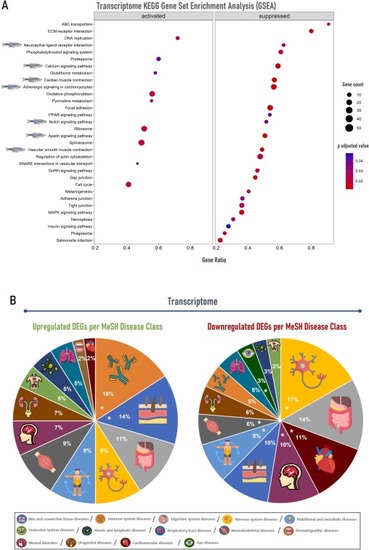
Gut transcriptome enrichment analysis and orthologs gene-disease class associations of zebrafish inoculated with tick saliva followed by mammalian meat consumption. (A) Gene set enrichment analysis (GSEA) using the Kyoto Encyclopedia of Genes and Genomes (KEGG) database was carried out with gseKEGG function from package clusterProfiler, employing 10 000 permutations and a Benjamini-Hochberg (BH) adjusted p-value lower than 0.05. The dotplot was created with the R package enrichplot and each downregulated pathway related to tick saliva allergy is pointed out with a zebrafish illustration. (B) Upregulated and downregulated ortholog differentially expressed genes (DEGs) represented by disease class using MeSH terms in DisGeNET platform. Disease class groups are marked with an asterisk (*) when DisGeNET enrichment analysis showed ≥ 4 significant diseases/class group in the upregulated gene set and ≥ 10 diseases/class group in the downregulated gene set. |
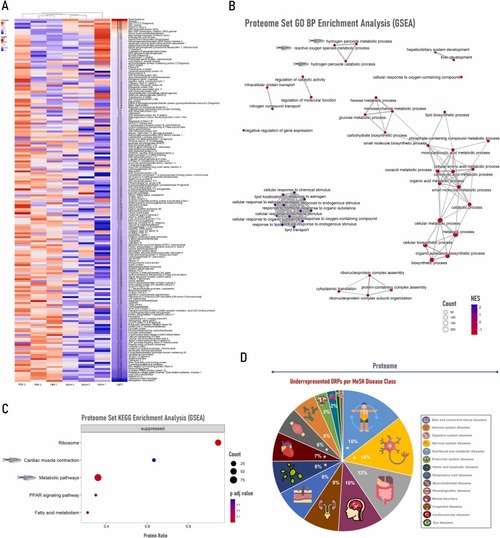
Gut proteome heatmap, enrichment analysis and orthologs disease class associations of zebrafish inoculated with tick saliva followed by mammalian meat consumption. (A) Heatmap of differentially represented proteins (DRPs), combining data from normalized Z-score values (Z-score) of pooled samples and logFoldChange (logFC). Heatmap creation was performed with the ComplexHeatmap package and the Heatmap function from R software, version 4.2.3. (B) Proteome biological process (BP) enrichment analysis (GSEA method) was executed with the gseGO function from clusterProfiler package, utilizing 10 000 permutations and a Benjamini-Hochberg (BH) adjusted p-value lower than 0.05. This emapplot was created with the R package enrichplot and each downregulated pathway related to tick saliva allergy is highlighted with a zebrafish illustration. (C) Proteome enrichment analysis (GSEA method) using the Kyoto Encyclopedia of Genes and Genomes (KEGG) database was carried out with gseKEGG function from package clusterProfiler, employing 10 000 permutations and a BH adjusted p-value lower than 0.05. The dotplot was created with the R package enrichplot and each downregulated pathway related to tick saliva allergy is emphasized with a zebrafish illustration. (D) Underrepresented DRPs characterized by disease class using MeSH terms from the DisGeNET platform. Disease Class Groups are marked with “* ” when DiGeNET enrichment analysis showed ≥ 10 diseases/class group in the underrepresented protein set. NES: Normalized Enriched Score. |
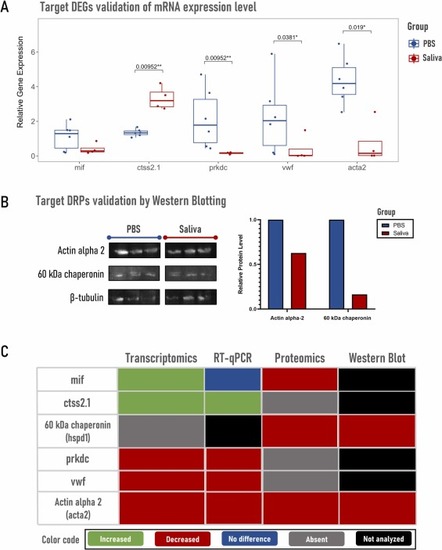
Validation of mRNA levels for target differentially expressed genes (DEGs) and corroboration of target differentially represented proteins (DRPs) levels, followed by summary of target results across all methods. (A) Quantification by reverse transcriptase quantitative PCR (RT-qPCR) of changes in mRNA levels of 5 target DEGs, including the 2 upregulated genes macrophage migration inhibitory factor (mif) and cathepsin S (ctss2.1), and 3 downregulated ones, namely DNA-dependent protein kinase (prkdc), von Willebrand factor (vwf) and smooth muscle alpha-actin (acta2). (B) Reliability of proteomics data was confirmed by Western blotting using antibodies against target DRPs, actin alpha 2 [UniProt ID: Q6DHS1] and 60 kDa chaperonin [UniProt ID: Q803B0] and the loading control β-tubulin. (C) Analyzed targets are represented by a color code based on fold change values and according to the applied methodology. |
|