
|
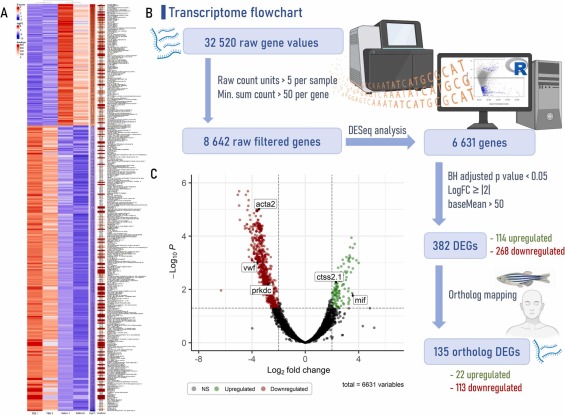
Fig. 2 Transcriptome pipeline and visual representation of gene expression from gut zebrafish underlying the effects of tick saliva followed by mammalian meat consumption. (A) Heatmap with the differentially expressed genes (DEGs) created using the ComplexHeatmap package and the Heatmap function from R software, version 4.2.3, combining data from normalized Z-score values (Z-score), log2FoldChange (logFC) and average overall expression level (baseMean or AveExpr). (B) Flowchart that leads to the acquisition of DEGs and ortholog DEGs. First step includes raw count units based on a minimum of 5 counts/sample and a minimum sum threshold of 50 counts/gene across all samples. Second step is the differential expression analysis for sequence data (DESeq), performed with Bioconductor (version 3.16) DESeq2 package [47] from R. Third step allows to extract DEGs based on a Benjamini-Hochberg (BH) adjusted p-value cutoff < 0.05, a logFC ≥ |2| and a baseMean > 50. Last step is ortholog mapping that utilizes the convert_othologs function from the orthogene package employed with the gprofiler method and the drop_both_species feature, allowing to obtain highly concordant biological 1:1 orthologs genes between zebrafish (Danio rerio – input species) and human (Homo sapiens – output species). (C) Volcano plot, highlighting DEGs of interest, created with the EnhancedVolcano package. acta2: smooth muscle alpha-actin; ctss2.1: cathepsin S; mif: macrophage migration inhibitory factor; prkdc: DNA-dependent protein kinase; vwf: von Willebrand factor.