
Fig. 4
- ID
- ZDB-FIG-240208-40
- Publication
- Vaz-Rodrigues et al., 2023 - Multi-omics analysis of zebrafish response to tick saliva reveals biological processes associated with alpha-Gal syndrome
- Other Figures
- All Figure Page
- Back to All Figure Page
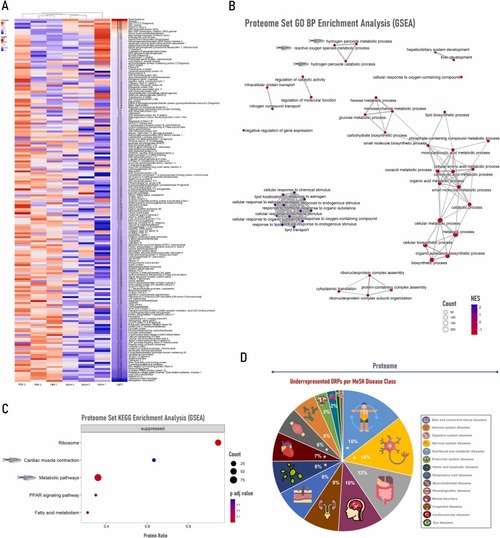
Gut proteome heatmap, enrichment analysis and orthologs disease class associations of zebrafish inoculated with tick saliva followed by mammalian meat consumption. (A) Heatmap of differentially represented proteins (DRPs), combining data from normalized Z-score values (Z-score) of pooled samples and logFoldChange (logFC). Heatmap creation was performed with the ComplexHeatmap package and the Heatmap function from R software, version 4.2.3. (B) Proteome biological process (BP) enrichment analysis (GSEA method) was executed with the gseGO function from clusterProfiler package, utilizing 10 000 permutations and a Benjamini-Hochberg (BH) adjusted p-value lower than 0.05. This emapplot was created with the R package enrichplot and each downregulated pathway related to tick saliva allergy is highlighted with a zebrafish illustration. (C) Proteome enrichment analysis (GSEA method) using the Kyoto Encyclopedia of Genes and Genomes (KEGG) database was carried out with gseKEGG function from package clusterProfiler, employing 10 000 permutations and a BH adjusted p-value lower than 0.05. The dotplot was created with the R package enrichplot and each downregulated pathway related to tick saliva allergy is emphasized with a zebrafish illustration. (D) Underrepresented DRPs characterized by disease class using MeSH terms from the DisGeNET platform. Disease Class Groups are marked with “* ” when DiGeNET enrichment analysis showed ≥ 10 diseases/class group in the underrepresented protein set. NES: Normalized Enriched Score. |