
- Title
-
Generation and characterization of a novel gne Knockout Model in Zebrafish
- Authors
- Livne, H., Avital, T., Ruppo, S., Harazi, A., Mitrani-Rosenbaum, S., Daya, A.
- Source
- Full text @ Front Cell Dev Biol

Generation of hGNEM743T/WT transgenic lines. (A) A schematic representation of the p(-1.9gne:hGNEM743T/WT; insulin:EGFP) plasmid. Genes, promoters, LTRs, polyadenylation signal and restriction sites are indicated. (B) The hGNE transgenic lines develop normally. The figure presents brightfield images of a WT (top), hGNEWT transgenic (middle), and hGNEM743T transgenic (bottom) larvae at 8 dpf. Scale bar = 1 mm. (C) RT-PCR analysis of hGNE mRNA expression in hGNEM743T and hGNEWT transgenic lines. Agarose gel electrophoresis of RT-PCR amplification products of the hGNE gene (top) and eef1a1a (bottom) as the internal control. Both the hGNEM743T (Mut) and hGNEWT (WT) cDNA samples show the expected amplification in all tested time points and tissues. Non-transgenic WT zebrafish cDNA (WT ZF cDNA) and genomic DNA from transgenic fish (Tg DNA) served as controls for each target. (NTC) no template control, (M) Muscle, (Br) Brain tissue. PHENOTYPE:
|
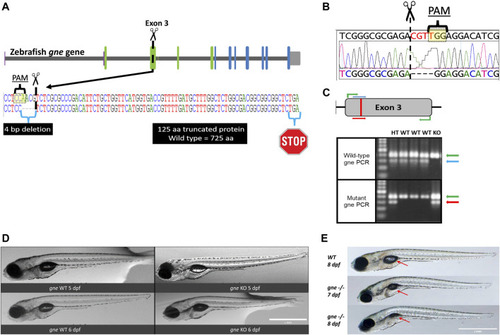
Generation and development of the gne knockout zebrafish. (A) Schematic representation of CRISPR/Cas9 mutagenesis in the zebrafish gne gene, exon 3. A diagram of the gne gene containing 12 exons, represented by green (epimerase domain) and blue (kinase domain) rectangles, and the UTRs. The PAM sequence is specified, position of the generated 4 bp deletion site is indicated by scissors symbol and the putative premature termination codon is depicted by a stop symbol. (B) Sanger sequencing chromatogram of gne KO larvae (bottom sequence) indicating a 4 bp deletion in gne exon 3. The PAM sequence and the double-strand break position (scissors) are indicated. (C) Zebrafish gne alleles PCR genotyping. The top panel represents a schematic view of the primers’ position in each PCR reaction. Wild-type specific PCR is presented on the top gel, and mutant specific on the bottom gel. Green arrows represent a 399 bp amplicon of exon 3. Blue arrows represent a 300 bp wild-type (WT) specific amplicon, red arrows represent the mutant (KO) specific amplicon. Heterozygotes (HT) show both allele-specific amplicons. 100 bp DNA marker was loaded on the left lanes of each 1.5% agarose gel. (D) Zebrafish gne KO larvae exhibit a normal phenotype at 5 and 6 dpf. gne genotype and age are indicated at the bottom of each image. Scale bar = 1 mm. (E) Zebrafish gne KO phenotype. Zebrafish gne KO larvae present deflation of the swim bladder and progressive curving of the body at 7 and 8 dpf, compared to WT zebrafish at 8 dpf. Red arrows indicate the swim bladder. Scale bar = 1 mm. |

Structural and functional characterization of the gne knockout larvae. (A) Analysis of morphologic measurements (body length, body height, eye diameter) in gne−/− mutants and WT larvae at 5 and 6 dpf did not show any statistically significant differences (Mann-Whitney Wilcoxon test, n = 40, p > 0.05). (B) gne KO larvae display reduced response to tactile stimuli in 'Touch-evoke assay'. Quantification of the assay revealed that gne KO larvae swim significantly less distance, compared to WT larvae, following tactile stimuli at 7 and 8.5 dpf (Mann-Whitney Wilcoxon test, n = 60). (C) Locomotor activity is not affected in gne KO larvae relative to their WT sibling. The mean velocity was calculated for each larva for 60 min, then averaged for each gne genotype at 5 and 7 dpf. (Mann-Whitney Wilcoxon test, n = 133). (D) Zebrafish gne KO heartbeat rate is significantly reduced only at 8.5 dpf (Mann-Whitney Wilcoxon test, n = 80). Significant differences are indicated by *p < 0.01, ****p < 0.00001, standard errors are presented. |

gne KO results in skeletal muscle defects which appear at 7 dpf. (A) A reduction in muscle birefringence is observed in gne KO larvae at 7 dpf, compared to WT sibling, and correlates to the severity of the phenotype at 8 dpf. (B) Quantification of the mean birefringence revealed a significant reduction in birefringence at 7 dpf, and highly significant at 8 dpf, compared to WT sibling controls (Mann-Whitney Wilcoxon test, n = 60). Significant differences are indicated by *p < 0.05, **p < 0.01, ****p < 0.00001, standard errors are presented. PHENOTYPE:
|

gne KO larvae present disorganization of muscle fibers at 5 dpf. (A) H&E staining of muscle cross-sections of gne WT (top) and gne KO (bottom) larvae display abnormally organized myofibers with undefined fiber bundles. Scale bar = 100 µm (left), 50 µm (middle and right). (B) Confocal imaging of whole-mount immunostained larvae at 5 dpf by gne genotype. gne KO exhibits a slightly wavy pattern of the slow muscle fibers (F59) and structurally normal fast fibers (stained with Actinin and Myomesin) with proper localization. Scale bar = 50 µm. |

gne KO larvae present disorganized slow and fast muscle fibers at 8 dpf. (A) Confocal imaging of F-actin stained gne KO muscle at 8 dpf. gne KO larvae show an abnormal Phalloidin staining pattern relative to the WT control at 8 dpf. Scale bar = 100 µm. (B) Confocal imaging of whole-mount immunostained larvae at 8 dpf by gne genotype. Zebrafish gne KO larvae exhibit impaired organization of the slow muscle fibers, stained with F59 antibody. Scale bar = 50 µm. (C) Confocal imaging of whole-mount immunostained larvae at 8 dpf by gne genotype. gne KO larvae exhibit a wavy pattern of the fast muscle fibers, and correct localization of Actin, Actinin, and Myomesin. Scale bar = 50 µm. |

Maternal and zygotic expression of gne WT and gne KO alleles. (A) gne maternal inheritance. gne+/- in-cross results in 3 genotypic groups. gne KO embryos are predicted to receive both gne+ and gne− maternal transcripts (blue arrow), but the zygotic transcription will only transcribe gne− alleles (red arrow). (B) Maternal expression of gne WT and gne mutant allele at 1 and 3 hpf embryos. The relative quantification (RQ) values of gne WT (blue bars) and gne mutant alleles (red bars) are shown by genotype and age. The WT allele was highly expressed in the WT samples and was lower in gne+/- offspring at 1 and 3 hpf. No amplification was obtained for the gne KO allele. cDNA sample of gne HT at 3 dpf was used as a calibrator for all reactions since it expresses both the WT and the KO alleles. (C) The relative expression of gne WT and gne KO alleles at 3, 5, and 7 dpf. The WT allele was highly expressed in the WT samples but was not found in gne KO at all-time points, and the mutated allele showed the opposite behavior. |

Exogenous sialic acid or hGNE transgene expression does not rescue the gne KO larvae. (A) Brightfield and birefringence representative images of 8 dpf larvae that participated in the sialic acid supplementation experiment: gne WT (top), gne KO (middle) and gne KO larvae with 800 μM sialic acid supplementation (bottom). The addition of sialic acid did not ameliorate the muscle phenotype, nor rescued gne KO larvae from mortality at 8–10 dpf. (B) Brightfield and birefringence images of GNE myopathy genetic model larvae display a phenotype similar to gne KO larvae at 8 dpf. (C) No significant differences were detected in morphologic measurements (body length, body height, eye diameter) between wild-type and hGNEM743T or hGNEWT transgenic KO models at 8 dpf. (Mann-Whitney Wilcoxon test, p > 0.05). Means of 10 larvae/variable/genotype and corresponding standard deviations are presented. (D) Transgene expression validation. Top: Fluorescent image of a representative 8 dpf Tg(ins:EGFP;hGNEM743T;gne−/−) larva showing EGFP expression in the pancreas. Scale bar = 1 mm. Bottom: Agarose gel electrophoresis of RT-PCR amplification products of the hGNE cDNA and eef1a1a. cDNA samples from both hGNEM743T and hGNEWT transgenic KO models show the expected amplification in all tested time points. Non-transgenic WT zebrafish cDNA (WT ZF cDNA) and genomic DNA from transgenic fish (Tg DNA) served as controls for each target. (NTC) no template control. PHENOTYPE:
|

Transcriptomics analysis of gne KO larvae. (A) PCA plots of gne KO vs. gne WT at 3 dpf, 5 dpf and 7 dpf. gne KO cluster separates from gne WT and gne HT from 5 dpf onwards. (B) MA plots of gne KO vs. gne WT at 3, 5 and 7 dpf. Red and orange dots refer to significant differentially expressed genes, black dots are for non-significant genes. (C) Hierarchical classification of DE genes in gne WT versus gne KO at 3 dpf (3 biological replicates). The figure presents upregulated (red) and downregulated (blue) genes. (CU915827.1 = si:dkey 31e10.5). (D) Venn diagram indicating the number of significant differentially expressed genes among gne KO and gne WT siblings at 3 (green), 5 (yellow) and 7 (blue) dpf. EXPRESSION / LABELING:
PHENOTYPE:
|

Gene set enrichment analysis (GSEA) plots of gne KO at 3 (A), 5 (B) and 7 (C) dpf. GSEA plots show the enrichment score on the y axis for genes related to each gene set. Genes are ordered on the x axis according to their GSEA enrichment score. FDR adjusted p-value (<0.05). |

Validation of the transcriptomic data. (A) Comparison of the fold-change values between RNA-sequencing and RT-qPCR data for 8 chosen DE genes shows consistency at 3 dpf and 7 dpf samples (20 embryos/sample, 2 biological replicates). Y axis represents the mean RQ values, standard deviations are presented. (B) Gene expression correlation between RT-qPCR and RNA-seq fold-change at 3 dpf and 7 dpf. Linear regression equations, R2 and p values are presented (Pearson’s correlation analysis). |