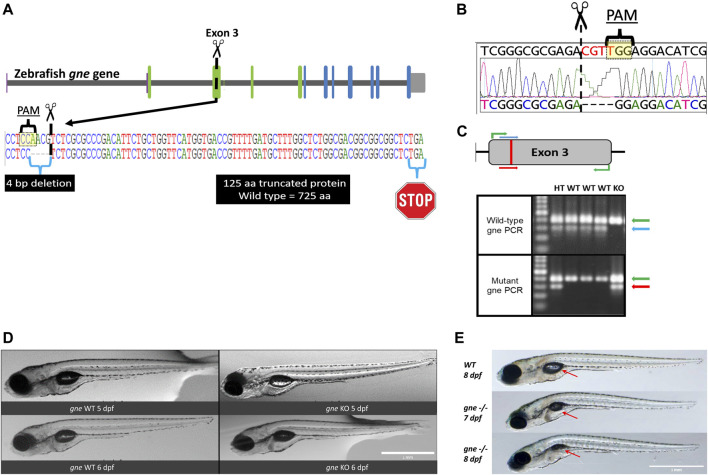
FIGURE 2 Generation and development of the gne knockout zebrafish. (A) Schematic representation of CRISPR/Cas9 mutagenesis in the zebrafish gne gene, exon 3. A diagram of the gne gene containing 12 exons, represented by green (epimerase domain) and blue (kinase domain) rectangles, and the UTRs. The PAM sequence is specified, position of the generated 4 bp deletion site is indicated by scissors symbol and the putative premature termination codon is depicted by a stop symbol. (B) Sanger sequencing chromatogram of gne KO larvae (bottom sequence) indicating a 4 bp deletion in gne exon 3. The PAM sequence and the double-strand break position (scissors) are indicated. (C) Zebrafish gne alleles PCR genotyping. The top panel represents a schematic view of the primers’ position in each PCR reaction. Wild-type specific PCR is presented on the top gel, and mutant specific on the bottom gel. Green arrows represent a 399 bp amplicon of exon 3. Blue arrows represent a 300 bp wild-type (WT) specific amplicon, red arrows represent the mutant (KO) specific amplicon. Heterozygotes (HT) show both allele-specific amplicons. 100 bp DNA marker was loaded on the left lanes of each 1.5% agarose gel. (D) Zebrafish gne KO larvae exhibit a normal phenotype at 5 and 6 dpf. gne genotype and age are indicated at the bottom of each image. Scale bar = 1 mm. (E) Zebrafish gne KO phenotype. Zebrafish gne KO larvae present deflation of the swim bladder and progressive curving of the body at 7 and 8 dpf, compared to WT zebrafish at 8 dpf. Red arrows indicate the swim bladder. Scale bar = 1 mm.
Image
Figure Caption
Figure Data
Acknowledgments
This image is the copyrighted work of the attributed author or publisher, and
ZFIN has permission only to display this image to its users.
Additional permissions should be obtained from the applicable author or publisher of the image.
Full text @ Front Cell Dev Biol

