
- Title
-
Development of epigenetic biomarkers for the identification of sex and thermal stress in fish using DNA methylation analysis and machine learning procedures
- Authors
- Valdivieso, A., Anastasiadi, D., Ribas, L., Piferrer, F.
- Source
- Full text @ Mol. Ecol. Resources
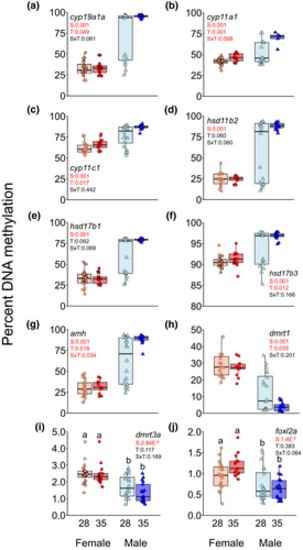
DNA methylation levels according to sex and early temperature. Box plot of percent DNA methylation levels on the promoter region of: (a) cyp19a1a, (b) cyp11a1, (c) cyp11c1, (d) hsd11b2, (e) hsd17b1, (f) hsd17b3, (g) amh, (h) dmrt1, (i) dmrt3a and (j) foxl2a genes from mature gonads of females and males exposed to 28°C and 35°C during sex differentiation (18–32 days post-fertilization).The p-values for the factor effects of sex (S), temperature (T) or the interaction of both factors (SxT) are reported for each gene. Two-way ANOVA followed by post hoc Tukey test was applied in the dmrt3a and foxl2a genes and two-way ANOVA with robust estimation was applied in the cyp19a1a, cyp11a1, cyp11c1, hsd11b2, hsd17b1, hsd17b3, amh and dmrt1 genes |
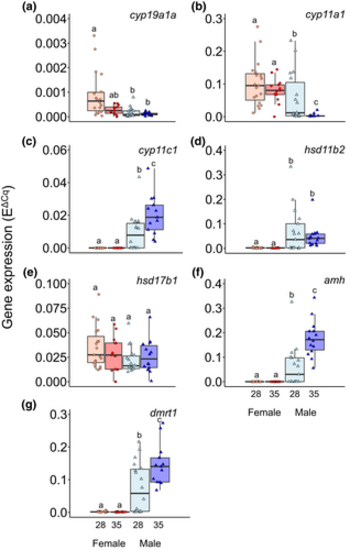
Gene expression levels according to sex and early temperature. Box plot of gene expression levels of (a) cyp19a1a, (b) cyp11a1, (c) cyp11c1, (d) hsd11b2, (e) hsd17b1, (f) amh and (g) dmrt1 genes in mature gonads of females and males exposed to 28°C and 35°C during sex differentiation (18–32 days post-fertilization). Two-way ANOVA followed by post hoc Tukey test was applied. Different letters indicate significant differences (p < .05) between sex and temperature |
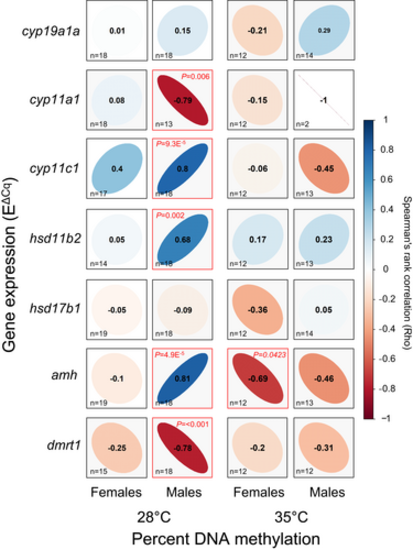
Relationship between DNA methylation and gene expression. Correlations of percentage DNA methylation of the promoter regions and gene expression levels for cyp19a1a, cyp11a1, cyp11a1, hsd11b2, hsd17b1, amh and dmrt1 in the gonads of females and males exposed to 28°C and 35°C during sex differentiation (18–32 days post-fertilization). Spearman's rank correlation coefficient (ρ) are shown. The direction of the long axis of the ellipses and the colour indicate the type of correlation: Negative is shown in red and positive in blue. The short axis of the ellipse and the intensity of the colour are proportional to the correlation coefficients. Significant correlations are considered when p < .05 (red frame square). The letter n inside the squares indicates the sample size for each correlation |
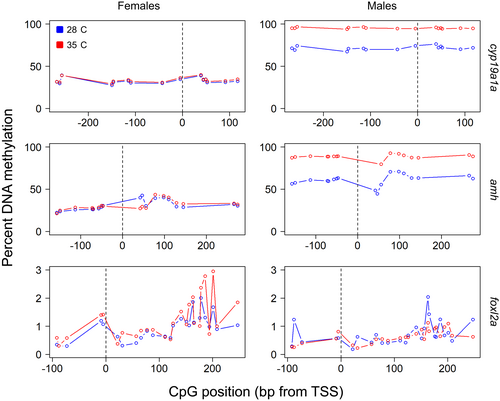
DNA methylation patterns in the adult gonads of females and males of zebrafish subjected to either low (control, blue) or elevated (red) temperature when larvae. Data indicated are for the steroidogenic enzyme cyp19a1a, the growth factor amh and the transcription factor foxl2a. Values on the x-axis show the distance in base pairs (bp) relative to the transcription start site (TSS) of the gene denoted as 0. Each datapoint corresponds to an individual CpG |
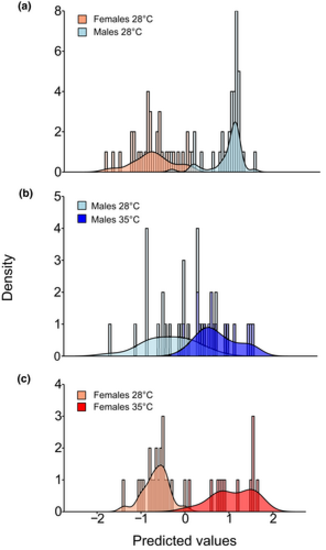
Flexible discriminant analysis (FDA) classifying samples according to sex or early temperature using DNA methylation. Density histogram of prediction values obtained from FDA using (a) cyp19a1a DNA methylation values to distinguish the sex of the fish, (b) amh DNA methylation values to distinguish males at 28°C from males at 35°C, and (c) foxl2a DNA methylation values to distinguish females at 28°C from females at 35°C |