
Image
|
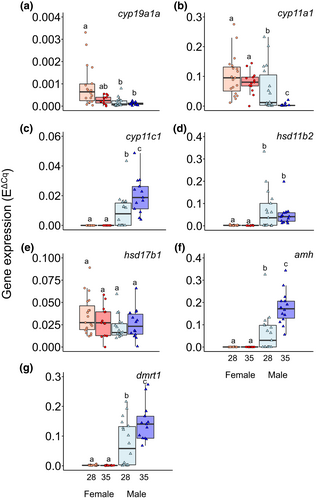
Figure Caption
Fig. 2 Gene expression levels according to sex and early temperature. Box plot of gene expression levels of (a) cyp19a1a, (b) cyp11a1, (c) cyp11c1, (d) hsd11b2, (e) hsd17b1, (f) amh and (g) dmrt1 genes in mature gonads of females and males exposed to 28°C and 35°C during sex differentiation (18–32 days post-fertilization). Two-way ANOVA followed by post hoc Tukey test was applied. Different letters indicate significant differences (p < .05) between sex and temperature
Acknowledgments
This image is the copyrighted work of the attributed author or publisher, and
ZFIN has permission only to display this image to its users.
Additional permissions should be obtained from the applicable author or publisher of the image.
Full text @ Mol. Ecol. Resources