
|
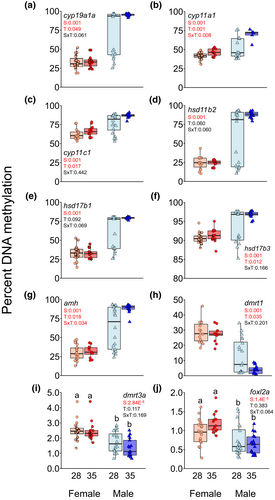
Fig. 1 DNA methylation levels according to sex and early temperature. Box plot of percent DNA methylation levels on the promoter region of: (a) cyp19a1a, (b) cyp11a1, (c) cyp11c1, (d) hsd11b2, (e) hsd17b1, (f) hsd17b3, (g) amh, (h) dmrt1, (i) dmrt3a and (j) foxl2a genes from mature gonads of females and males exposed to 28°C and 35°C during sex differentiation (18–32 days post-fertilization).The p-values for the factor effects of sex (S), temperature (T) or the interaction of both factors (SxT) are reported for each gene. Two-way ANOVA followed by post hoc Tukey test was applied in the dmrt3a and foxl2a genes and two-way ANOVA with robust estimation was applied in the cyp19a1a, cyp11a1, cyp11c1, hsd11b2, hsd17b1, hsd17b3, amh and dmrt1 genes