
Fig. 3
- ID
- ZDB-FIG-230605-49
- Publication
- Valdivieso et al., 2022 - Development of epigenetic biomarkers for the identification of sex and thermal stress in fish using DNA methylation analysis and machine learning procedures
- Other Figures
- All Figure Page
- Back to All Figure Page
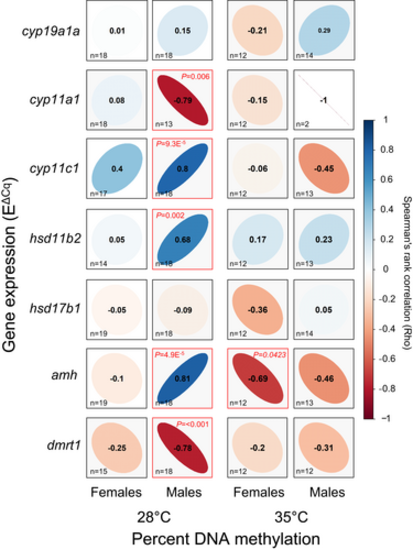
Relationship between DNA methylation and gene expression. Correlations of percentage DNA methylation of the promoter regions and gene expression levels for cyp19a1a, cyp11a1, cyp11a1, hsd11b2, hsd17b1, amh and dmrt1 in the gonads of females and males exposed to 28°C and 35°C during sex differentiation (18–32 days post-fertilization). Spearman's rank correlation coefficient (ρ) are shown. The direction of the long axis of the ellipses and the colour indicate the type of correlation: Negative is shown in red and positive in blue. The short axis of the ellipse and the intensity of the colour are proportional to the correlation coefficients. Significant correlations are considered when p < .05 (red frame square). The letter n inside the squares indicates the sample size for each correlation |