
Image
|
Figure Caption
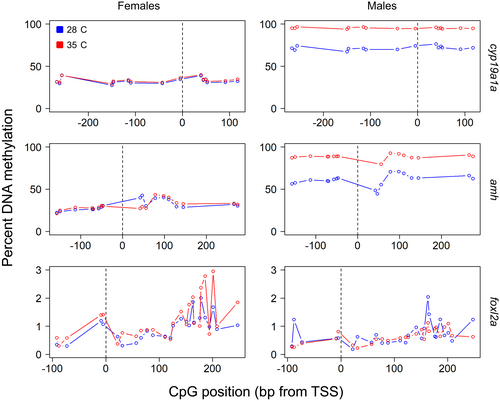
Fig. 4 DNA methylation patterns in the adult gonads of females and males of zebrafish subjected to either low (control, blue) or elevated (red) temperature when larvae. Data indicated are for the steroidogenic enzyme cyp19a1a, the growth factor amh and the transcription factor foxl2a. Values on the x-axis show the distance in base pairs (bp) relative to the transcription start site (TSS) of the gene denoted as 0. Each datapoint corresponds to an individual CpG
Acknowledgments
This image is the copyrighted work of the attributed author or publisher, and
ZFIN has permission only to display this image to its users.
Additional permissions should be obtained from the applicable author or publisher of the image.
Full text @ Mol. Ecol. Resources