|
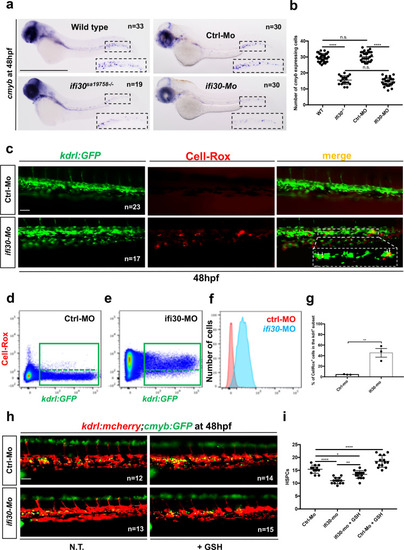
<italic>ifi30</italic>-deficiency increases ROS levels in ECs and induces a defect in HSPC proliferation.acmyb expression at 48 hpf in wild type and ifi30−/− embryos, after the injection of control or ifi30-morpholino. b Quantification of cmyb-expressing cells. Statistical analysis: one-way ANOVA, with Tukey–Kramer post hoc tests, adjusted for multiple comparisons, ****P < 0.0001, (n.s.) non-significant P = 0.84; P = 0.32. Center values of all statistical analysis denote the mean, and error values denote s.e.m. c Confocal imaging in the CHT of kdrl:GFP+ cells (green), CellROX fluorescent probe (red) and merge (yellow). d Representative FACS plots showing dissociated zebrafish embryos after injection of control or (e) ifi30-morpholinos. FACS plots are gated on live cells. f Histogram plot showing the overlap of both samples, gated on kdrl+ cells. g Quantification of the percentage of kdrl:GFP+ cells affected by oxidative stress (ROS+) in ifi30-morphants (ifi30-MO) and controls (ctrl-MO) at 48 hpf. Data points are the mean of n = 4 biological replicates ± SD. Statistical analysis: unpaired two-tailed t test, **P = 0.007. Center values of all statistical analysis denote the mean, and error values denote s.e.m. h Fluorescence imaging in the CHT of kdrl:mCherry;cmyb:GFP embryos injected with control- and ifi30-MOs and treated with GSH. i Quantification of HSPCs associated with ECs. Statistical analysis: one-way ANOVA, with Tukey–Kramer post hoc tests, adjusted for multiple comparisons, *P = 0.028; **P = 0.008; ****P < 0.0001. The center values of all statistical analyses denote the mean, and error values denote s.e.m. Scale bars: 200 μm (a), 100 μm (c, d).
EXPRESSION / LABELING:
|
Gene:
|
|
|
Fish:
|
|
|
Condition:
|
|
|
Knockdown Reagent:
|
|
|
Anatomical Term:
|
|
|
Stage:
|
Long-pec
|
PHENOTYPE:
|
Fish:
|
|
|
Condition:
|
|
|
Knockdown Reagent:
|
|
| Observed In: |
|
|
Stage:
|
Long-pec
|
|

