
- Title
-
Anti-tuberculosis effect of isoniazid scales accurately from zebrafish to humans
- Authors
- van Wijk, R.C., Hu, W., Dijkema, S.M., van den Berg, D.J., Liu, J., Bahi, R., Verbeek, F.J., Simonsson, U.S.H., Spaink, H.P., van der Graaf, P.H., Krekels, E.H.J.
- Source
- Full text @ Br. J. Pharmacol.

Experimental study design. Fertilized eggs at 0 days post fertilization (dpf) were harvested and injected with 200 CFU |

Internal isoniazid exposure over time in zebrafish larvae for increasing isoniazid doses. Internal exposure as pmol per larva in homogenate samples (left five panels) or as pmol·μl−1 in blood samples (right panel) is shown on a semi‐logarithmic scale for waterborne doses in the external treatment medium, from 0.5‐ to 10‐fold MIC, as indicated in each graph (MIC = 15 mg·L−1), for a constant treatment period of 50 h. Internal exposure linearly increases with dose, and steady state amounts increase with age, suggesting increased net absorption. Open symbols show observations below LLOQ |

Bacterial burden in individual zebrafish larvae quantified by fluorescence imaging. (a) Representative images (brightfield [top], red fluorescence channel [middle], and overlay [bottom]) for control and 5‐fold MIC treatment groups at 2, 3, and 4 dpi (MIC = 15 mg·L−1). (b) The bacterial burden in fluorescent pixel count quantified by automated image analysis for control and treatment groups with doses 0.25–5× MIC (at least |

Schematic representation of the pharmacokinetic–pharmacodynamic model quantifying the internal exposure of isoniazid and its response on the bacterial burden in zebrafish larvae. Compartments represent (a) drug concentration or (b) bacterial count inside the larva, solid straight arrows represent pharmacokinetic mass transfer, the curved arrow represents bacterial growth, and the dashed arrow represents drug response. The top compartment shows the pharmacokinetic component of the model for isoniazid (INH) with a first‐order absorption rate constant ( |

Model‐based prediction of the internal isoniazid exposure in zebrafish larvae of the final pharmacokinetic–pharmacodynamic model. Visual predictive check with median (solid line) and 95% prediction interval (dashed lines, shaded area) from 500 simulations based on the pharmacokinetic component of the final model shows good prediction of the observed data (symbols, at least |
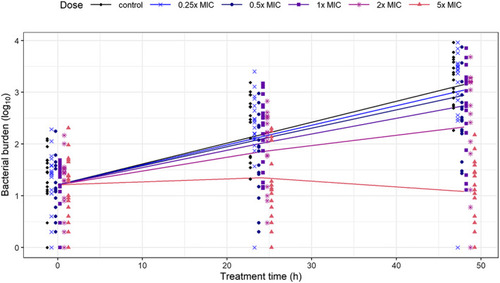
Observed and model‐based prediction of the bacterial burden after isoniazid treatment in individual zebrafish larvae infected with |

Translation of isoniazid response in zebrafish larvae to humans, using a model‐based pharmacokinetic–pharmacodynamic approach. (a) isoniazid concentration–time profile (median: solid line, 80% prediction interval: shaded area) after 7 days of daily isoniazid doses of 150, 300, and 450 mg as simulated from a previously published pharmacokinetic model (Wilkins et al., 2011). (b) Simulated median (solid line) and 80% prediction interval (shaded area, including biological and experimental variability) bacterial burden in CFU·ml−1 sputum based on the human isoniazid concentration–time profile for 1,000 individuals per dose group. Concentration–time profiles were linked to the exposure–response relationship quantified in zebrafish larvae together with the translational factors on isoniazid sensitivity (MIC) and stage of infection (logarithmic vs. stationary). Translated response corresponds well to the observed bacterial burden in sputum, from Hafner et al., (1997; triangles), Johnson et al., (2006; squares) and Li et al., (2010; circles). Orange part of the prediction is extrapolated in time from the 48 h of treatment studied in the zebrafish, shown in black |