
Image
|
Figure Caption
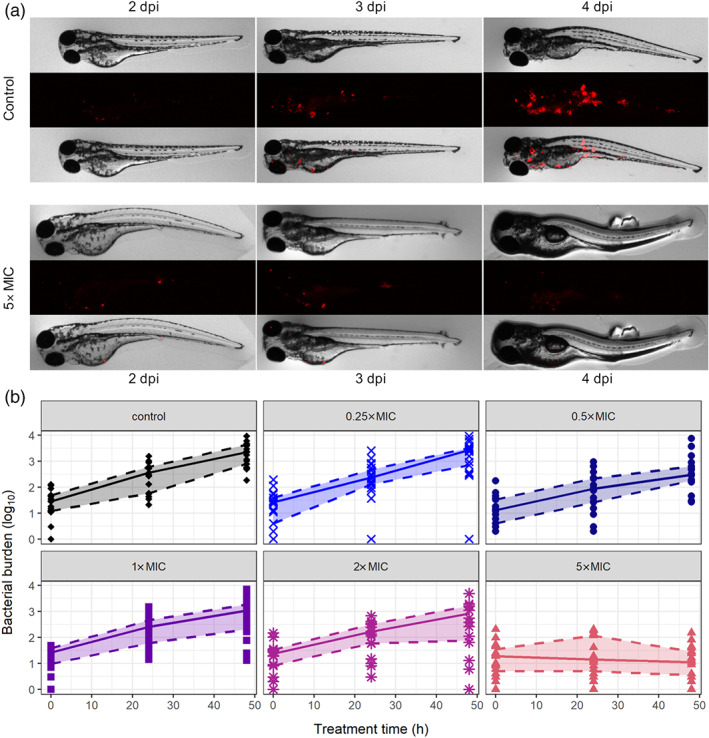
FIGURE 3
Bacterial burden in individual zebrafish larvae quantified by fluorescence imaging. (a) Representative images (brightfield [top], red fluorescence channel [middle], and overlay [bottom]) for control and 5‐fold MIC treatment groups at 2, 3, and 4 dpi (MIC = 15 mg·L−1). (b) The bacterial burden in fluorescent pixel count quantified by automated image analysis for control and treatment groups with doses 0.25–5× MIC (at least
Acknowledgments
This image is the copyrighted work of the attributed author or publisher, and
ZFIN has permission only to display this image to its users.
Additional permissions should be obtained from the applicable author or publisher of the image.
Full text @ Br. J. Pharmacol.