IMAGE

FIGURE 6

ID
ZDB-IMAGE-201211-12
Source
Figures for van Wijk et al., 2020
Image
Figure Caption

FIGURE 6

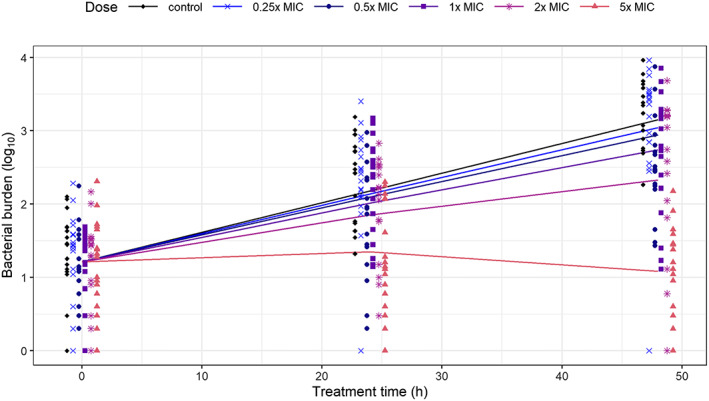
Observed and model‐based prediction of the bacterial burden after isoniazid treatment in individual zebrafish larvae infected with Mycobacterium marinum. The bacterial burden as log10‐transformed fluorescent pixel count is shown over treatment time of 50 h at isoniazid doses in the external treatment medium of 0.25×, 0.5×, 1×, 2×, and 5‐fold MIC, in addition to control. Symbols represent observed data (at least n = 17 individual larvae, measured daily), and lines connect model predictions. Biological variability as quantified by the model is relatively large in contrast to experimental variability (see Figure S3 for individual predictions)

Acknowledgments
This image is the copyrighted work of the attributed author or publisher, and ZFIN has permission only to display this image to its users. Additional permissions should be obtained from the applicable author or publisher of the image. Full text @ Br. J. Pharmacol.