- Title
-
Distribution and neuronal circuit of spexin 1/2 neurons in the zebrafish CNS
- Authors
- Kim, E., Jeong, I., Chung, A.Y., Kim, S., Kwon, S.H., Seong, J.Y., Park, H.C.
- Source
- Full text @ Sci. Rep.
|
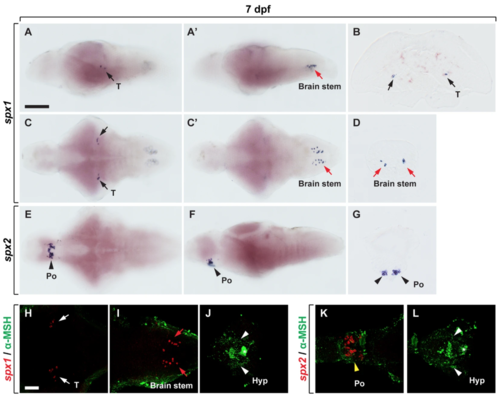
Expression of spx 1 and spx 2 mRNA in the brain of zebrafish larvae. (A–G) In situ RNA hybridization with spx1 (A–D) and spx2RNA probes (E–G) in the brain of zebrafish larvae at 7 days post-fertilisation (dpf). Lateral (A,A’,F), dorsal (C,C’), and ventral views (E) of the brain, anterior to the left. Transverse sections of the brain (B,D,G), dorsal to the top. (A–D) spx1 expression in the midbrain (A–C) and hindbrain (A’,C’,D). Black and red arrows indicate spx1 expression in the midbrain tegmentum and hindbrain, respectively. (E–G) spx2 mRNA expression in the preoptic area of the hypothalamus. Arrowheads indicate spx2expressing cells. (E–G,K,L). (H–L) Labelling with anti-α-melanocyte stimulating hormone (α-MSH) antibody following in situ RNA hybridization with spx1 (H–J) and spx2 (K,L). Ventral views with anterior to the left. White and red arrows indicate spx1-expressing cells in the midbrain (H) and hindbrain (I), and yellow arrowhead indicates spx2-expressing cells in the preoptic area (K). White arrowheads and asterisk label the hypothalamus and pituitary gland, respectively. Abbreviation: Hyp, hypothalamus; Po, preoptic region; T, midbrain tegmentum. Scale bar: 100 μm in A,A’,C,C’,E,F,E; 50 μm in B,D,G–L. EXPRESSION / LABELING:
|
|
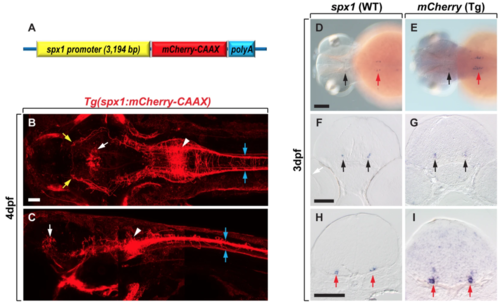
Tg(spx1:mCherry-CAAX) zebrafish express mCherry-CAAX in spx1-expressing cells. (A) Schematic of the plasmid construct for the generation of Tg(spx1:mCherry-CAAX) zebrafish. (B,C) Dorsal (B) and lateral (C) views of Tg(spx1:mCherry-CAAX) zebrafish at 4 days post-fertilisation (dpf), anterior to the left. White arrowheads designate spx1-expressing neurons in the hindbrain, and blue arrows indicate spx1+ axonal projections to the spinal cord. White arrows mark the midbrain tegmentum, and yellow arrows label spx1+ axonal projections to the forebrain. (D–I) In situ RNA hybridization of 3 dpf wildtype and Tg(spx1:mCherry-CAAX) embryos with spx1 (D,F,H) and mcherry mRNA (E,G,I), respectively. Dorsal views of whole-mount embryos with anterior to the left (D,E), and transverse sections of the brain with dorsal to the top (F–I). Black and red arrows indicate labelled cells in the midbrain tegmentum and hindbrain, respectively. Scale bar: 50 μm in B,C,F–I; 100 μm in D,E. EXPRESSION / LABELING:
|
|
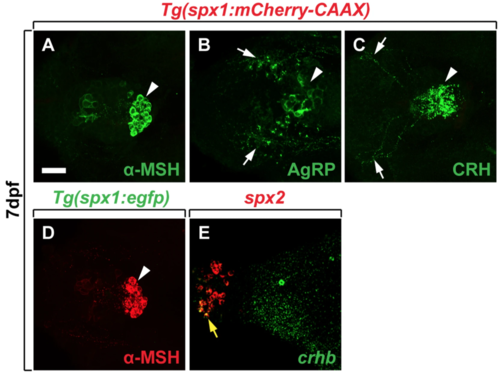
spx 1 and spx 2 expression in the hypothalamic area of zebrafish larvae. (A–E) Labelling of 7 dpf Tg(spx1:mCherry-CAAX) (A–C), Tg(spx1:gal4; uas:egfp) (D), and wildtype larvae (E) with antibodies against α-melanocyte-stimulating hormone (α-MSH) (A,D), agouti-related peptide (AgRP) (B), corticotropin-releasing hormone (CRH) (C), and corticotropin releasing hormone b(crhb) RNA probe (E). Ventral views with anterior to the left. White arrowheads indicate α-MSH expression in the pituitary gland (A,D), and white arrows label AgRP-expressing neurons in the ventral hypothalamus (B) and CRH+ axons in the hypothalamus (C). (E) Expression of spx2 and crhb mRNA in the larval brain revealed by in situ RNA hybridization. Yellow arrow designates neurons co-expressing spx2 and crhb mRNA in the preoptic region of the hypothalamus. Scale bar: 25 μm. EXPRESSION / LABELING:
|
|
Characterisation of hindbrain SPX1 neurons and their projections. Dorsal (A) and lateral (C,F) views of zebrafish larvae at 3 days post-fertilisation (dpf), anterior to the left. Transverse sections of the hindbrain (B,D,D’,E,E’) and spinal cord (G,G’) at 3 dpf, dorsal to the top. (A,B) Labelling of Tg(spx1:mCherry-CAAX) larvae with anti-3A10 and anti-HuC/D antibodies to detect Mauthner axons (A, green) and post-mitotic neurons (B, green), respectively. (C) Tg(spx1:mCherry-CAAX); Tg(isl1:gfp) larvae to detect hindbrain SPX1 neurons and cranial motor neurons (green). (D,D’) Labelling of Tg(spx1:mCherry-CAAX) larvae with anti-Pax2 antibody (green). mCherry-CAAX fluorescence is detected in the membrane surrounding Pax2a+ neuronal cell bodies. (E,E’) Transverse section of the hindbrain of Tg(spx1:mCherry-CAAX); Tg(chx10:gfp) larvae. Arrowheads indicate spx:mCherry+/chx10:EGFP− neurons. (F) Lateral view of the spinal cord of Tg(spx1:mCherry-CAAX); Tg(galr2b:egfp) larvae. Arrows indicate spinal projections of hindbrain SPX1 neurons. (G,G’) Transverse sections of the spinal cord of Tg(spx1:mCherry-CAAX); Tg(galr2b:egfp) larvae. White arrows indicate the axonal projections of hindbrain SPX1 neurons, which interact with galr2b-expressing neurons in the dorsal spinal cord. Yellow arrows indicate the axonal projections of hindbrain SPX1 neurons in the ventral spinal cord. Abbreviation: M, Mauthner neuron; r, rhombomere. Scale bar: 25 μm EXPRESSION / LABELING:
|
|
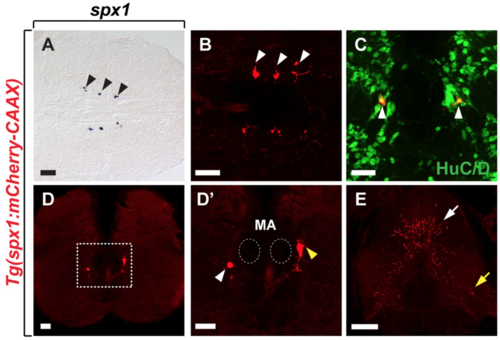
Characterisation of SPX1 neurons in the hindbrain of adult zebrafish. Horizontal (A,B) and transverse (C–E) sections of the brain (A–D’) and spinal cord (E) of adult Tg(spx1:mCherry-CAAX) zebrafish. (A,B) Anterior is to the left and (C–E) dorsal is to the top. SPX1 neurons revealed by whole-mount in situ RNA hybridization with spx1 RNA (A) and spx1:mCherry expression (B). (C) Labelling of the hindbrain of Tg(spx1:mCherry-CAAX) adult zebrafish with anti-HuC/D antibody. (B,C) White arrowheads indicate spx1:mCherry neurons in the brainstem. (D) spx1:mCherry expression is detected in the inferior reticular formation region of the hindbrain. (D’) Magnified image of the boxed area in the panel D. Dotted circles mark the position of Mauthner axons in the hindbrain. White and yellow arrowheads indicate the inferior reticular formation region and vagal motor nucleus region, respectively. (E) Axons of hindbrain SPX1 neurons projecting to the spinal cord. White and yellow arrows indicate axonal projections in the dorsal and ventral spinal cord, respectively. Abbreviation: MA, Mauthner axon. Scale bar: 50 μm. EXPRESSION / LABELING:
|
|
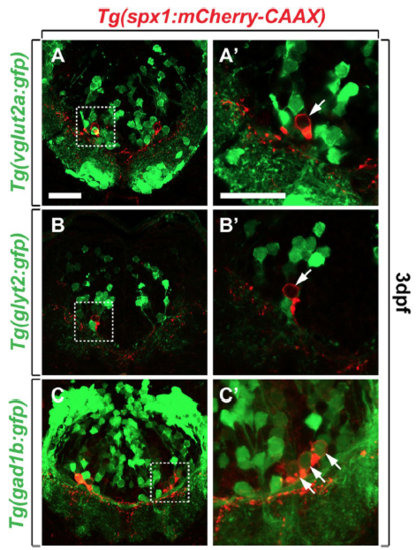
Identification of neurotransmitter phenotype of SPX1 neurons in the hindbrain. (A–C’) Transverse sections of the hindbrain of Tg(spx1:mCherry-CAAX); Tg(vglut2a:gfp) (A,A’), Tg(spx1:mCherry-CAAX); Tg(glyt2:gfp) (B,B’), and Tg(spx1:mCherry-CAAX); Tg(gad1b:gfp) (C,C’) at 3 days post-fertilisation (dpf), dorsal to the top. Panels labelled with a prime are the magnified images of the boxed areas in each panel. Arrows mark vglut2a-negative (A’), glyt2-negative (B’) and gad1b-positive (C’) spx1-expressing neurons in the hindbrain. Scale bar: 25 μm. EXPRESSION / LABELING:
|
|
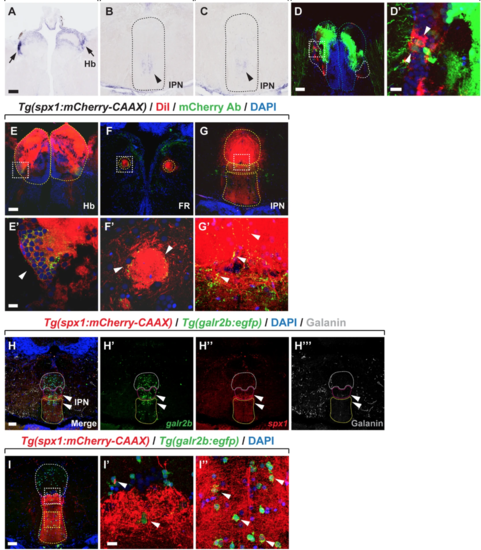
SPX1 and GALR2a/2b expression in the habenula and interpeduncular nucleus. Transverse sections of the adult zebrafish brain, dorsal to the top. (A–C) In situ RNA hybridization in the adult brain with spx1 (A), galr2a (B), and galr2b (C) RNA. (A) Arrows indicate the expression of spx1 mRNA in the habenula. Black arrowheads indicate galr2a and galr2b mRNA expression, respectively, in the IPN (B,C). (D,D’) Transverse sections of the habenula (D) of Tg(spx1:mCherry-CAAX); Tg(pou4f1-hsp70l:gfp) zebrafish. (D) White, green, and blue dotted lines mark lateral and medial subdivisions of the dorsal habenula and ventral habenula, respectively. (D’) is a high magnification image of the box area in (D). White arrowheads indicate pou4fl+ spx1:mCherry-expressing cell body in the dHbM. (E–G’) Transverse section of the Hb (E,E’), FR (F,F’), and IPN (G,G’) of DiI-labelled Tg(spx1:mCherry-CAAX) zebrafish. Panel E’–G’ are high magnification images of white boxes in panel E–G. Yellow dotted lines mark DiI-labelled Hb (E), FR (F), and IPN (G). White arrowheads indicate that co-localization of DiI and mCherry fluorescence. (H–I”) Transverse sections of Tg(spx1:mCherry-CAAX); Tg(galr2b:egfp) zebrafish, which were labelled with DAPI. White, magenta, and yellow dotted lines mark the dorsal, intermediate, and ventral IPN, respectively. (H–H”’) Section views labelled with anti-galanin antibody. White arrowheads indicate the intermediate and ventral IPN, where spx1:mCherry+ axonal projections were observed. (I–I”) Panel I’ and I” are high magnification images of white and yellow boxes of panel I, respectively. White arrowheads indicate close contacts between EGFP+ cells and mCherry+ nerve fibres. Abbreviation: FR, fasciculus retroflexus; Hb, habenula; IPN, interpeduncular nucleus; Scale bar: 50 μm in A–I. 10 μm in D’–I”. EXPRESSION / LABELING:
|
|
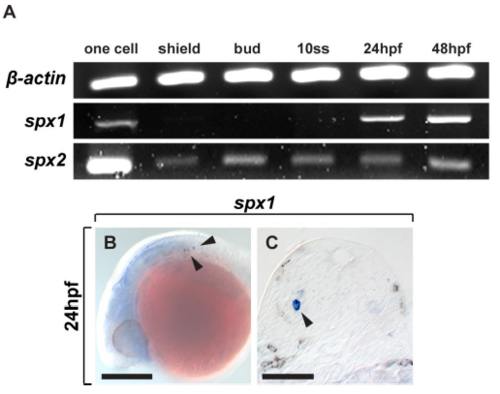
Reverse transcriptase PCR (RT-PCR) and in situ RNA hybridization of spx1 and spx2 during early developmental stages in zebrafish. (A) RT-PCR of spx1 and spx2. cDNA from early developmental stages were used. β-actin was used as a control gene for RT-PCR. (B) In situ RNA hybridization using spx1 anti-sense RNA probe at 24 hpf. Lateral view of the brain and anterior is to the left. Arrowheads indicate the expression of spx1 mRNA in the hindbrain. (C) Transverse sections of the brain in (B) and dorsal is to the top. Arrowhead indicates the spx1-expressing cell in the hindbrain. Abbreviation: -ss, somite-stage. Scale bar: 100 μm in B and C. |
|
Generation of Tg(spx1:gal4);Tg(uas:egfp) zebrafish. (A) Schematic of the plasmid construct. (B) Lateral view of Tg(spx1:gal4);Tg(uas:egfp) zebrafish at 5 days post fertilisation (dpf). Yellow and white arrows indicate spx1-expressing neurons in the midbrain and hindbrain, respectively. Scale bar: 50 μm |
|
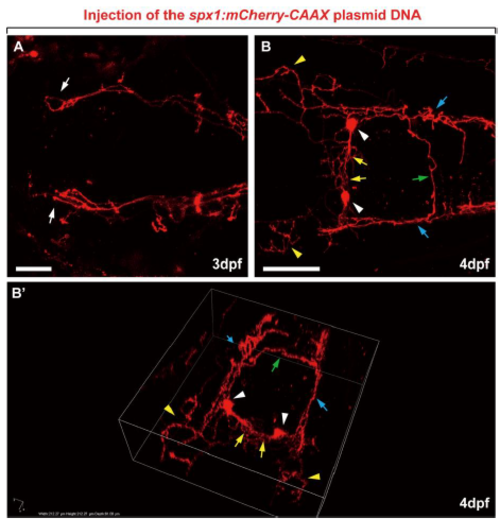
Mosaic analysis of the axonal projections of hindbrain spx1+ neurons. (A-B) Dorsal views of the hindbrain of 2 days post fertilisation (dpf) (A) and 3 dpf (B, B’) zebrafish larvae injected with spx1:mCherry-CAAX recombinant DNA, anterior to the left. (A) White arrows indicate the axonal projections of spx1-expressing hindbrain neurons in the forebrain and midbrain. (B-B’) Panel B’ is the three-dimensional rendering image of panel B. White arrowheads mark spx1-expressing neuronal cell bodies in the hindbrain. Yellow arrows designate axonal projections to the midline from hindbrain spx1:mCherry+ neurons. Yellow arrowheads label the ascending projections to the forebrain and midbrain. Blue and green arrows mark descending projections to the spinal cord and the projections crossing the midline, respectively. (B-B’) Direction X: anterior-side, Y: right-side, Z: ventral-side. White box size: Width: 212.27 μm, height: 212.27 μm, depth: 81.00 μm. Scale bar: 50 μm. |
|
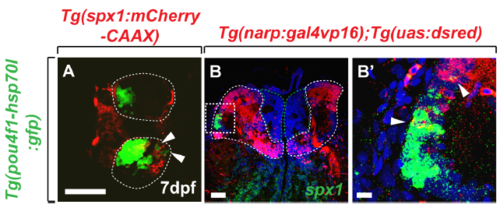
Expression of spx1 in dorsal Hb. (A) Dorsal view of the Hb region in Tg(spx1:mCherry-CAAX);Tg(pou4fl-hsp70l:gfp) larva at 7 dpf. Arrowheads indicate the spx1 and pou4fl+ cells in Hb. (B, B’) Transverse section of the Hb in Tg(narp:gal4vp16);Tg(uas:dsred) adult brain labelled by spx1 RNA and dorsal is to the top. (B’) is a high magnification image of the box area in (B). Arrowhead indicates the spx1 and narp+ cells in lateral division of the dorsal Hb. Abbreviation: Hb, habenula; IPN, interpeduncular nucleus. Scale bar: 50 μm in A and B. 10 μm in B’. |

