
Fig. S3
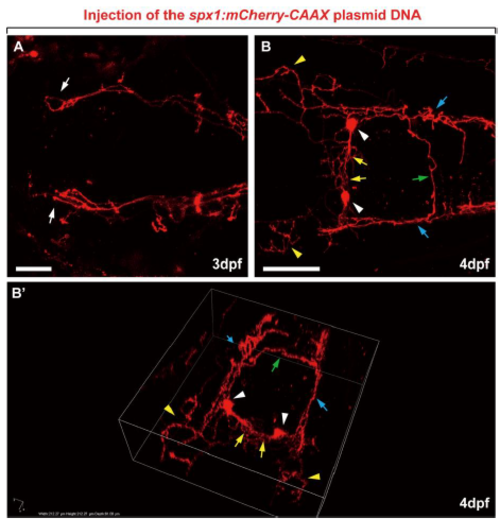
Mosaic analysis of the axonal projections of hindbrain spx1+ neurons. (A-B) Dorsal views of the hindbrain of 2 days post fertilisation (dpf) (A) and 3 dpf (B, B’) zebrafish larvae injected with spx1:mCherry-CAAX recombinant DNA, anterior to the left. (A) White arrows indicate the axonal projections of spx1-expressing hindbrain neurons in the forebrain and midbrain. (B-B’) Panel B’ is the three-dimensional rendering image of panel B. White arrowheads mark spx1-expressing neuronal cell bodies in the hindbrain. Yellow arrows designate axonal projections to the midline from hindbrain spx1:mCherry+ neurons. Yellow arrowheads label the ascending projections to the forebrain and midbrain. Blue and green arrows mark descending projections to the spinal cord and the projections crossing the midline, respectively. (B-B’) Direction X: anterior-side, Y: right-side, Z: ventral-side. White box size: Width: 212.27 μm, height: 212.27 μm, depth: 81.00 μm. Scale bar: 50 μm. |