
Image
|
Figure Caption
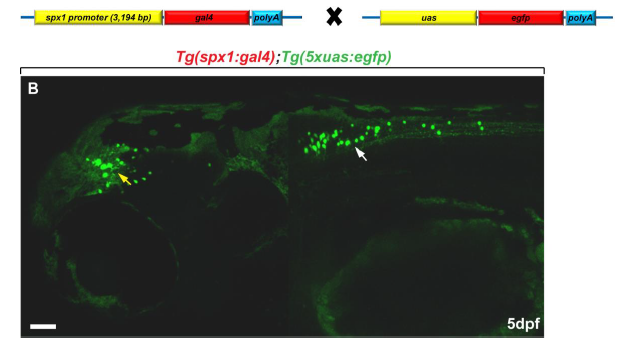
Fig. S2
Generation of Tg(spx1:gal4);Tg(uas:egfp) zebrafish. (A) Schematic of the plasmid construct. (B) Lateral view of Tg(spx1:gal4);Tg(uas:egfp) zebrafish at 5 days post fertilisation (dpf). Yellow and white arrows indicate spx1-expressing neurons in the midbrain and hindbrain, respectively. Scale bar: 50 μm
Acknowledgments
This image is the copyrighted work of the attributed author or publisher, and
ZFIN has permission only to display this image to its users.
Additional permissions should be obtained from the applicable author or publisher of the image.
Full text @ Sci. Rep.