- Title
-
scRNA-Seq reveals distinct stem cell populations that drive hair cell regeneration after loss of Fgf and Notch signaling
- Authors
- Lush, M.E., Diaz, D.C., Koenecke, N., Baek, S., Boldt, H., St Peter, M.K., Gaitan-Escudero, T., Romero-Carvajal, A., Busch-Nentwich, E.M., Perera, A.G., Hall, K.E., Peak, A., Haug, J.S., Piotrowski, T.
- Source
- Full text @ Elife
|
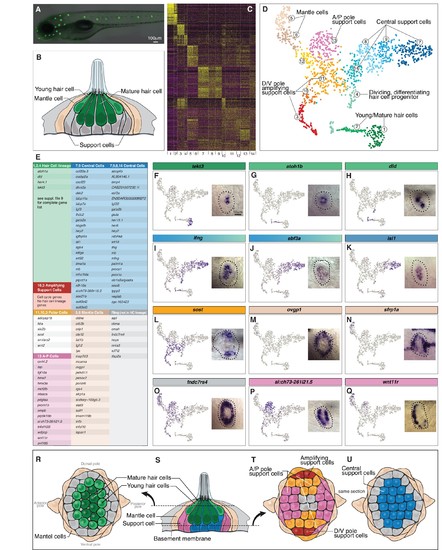
Single cell RNA-Seq reveals support cell heterogeneity.(A) Et(Gw57a) labels support cells with GFP. (B) Schematic of a cross section through a neuromast. (C) Heatmap showing the expression levels of the top 50 marker genes (y-axis) for each cluster (x-axis), sorted by highest fold change. (D) t-SNE plot showing the different cell clusters. (E) Table of marker genes that distinguish the different cell clusters. (F–Q) t-SNE plots of selected cluster markers and in situ hybridization with these genes. (R, T and U) Schematics of dorsal views of neuromasts with the different cell types colored. (S) Schematic of a cross section through the center of a neuromast. EXPRESSION / LABELING:
|

ZFIN is incorporating published figure images and captions as part of an ongoing project. Figures from some publications have not yet been curated, or are not available for display because of copyright restrictions. EXPRESSION / LABELING:
|
|
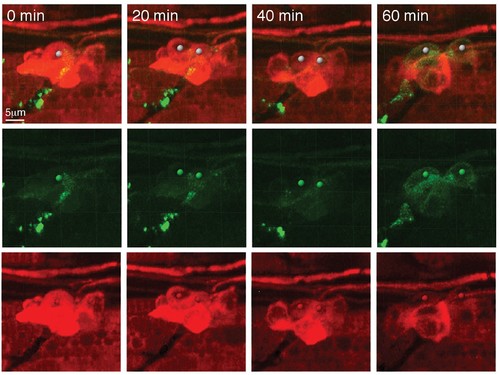
Still images of a video of prox1a:tagRFP-positive cells differentiating into pou4f3:gfp-positive hair cells. |

ZFIN is incorporating published figure images and captions as part of an ongoing project. Figures from some publications have not yet been curated, or are not available for display because of copyright restrictions. EXPRESSION / LABELING:
|

ZFIN is incorporating published figure images and captions as part of an ongoing project. Figures from some publications have not yet been curated, or are not available for display because of copyright restrictions. |
|
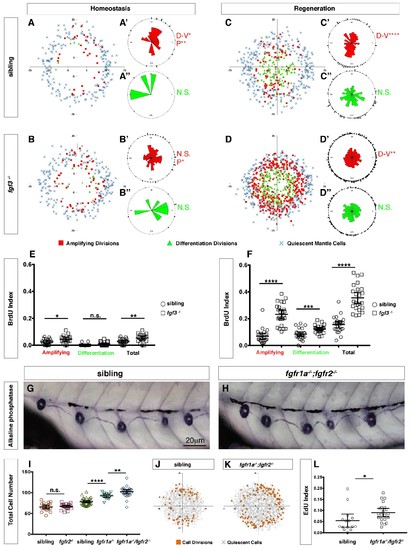
Loss of fgf3-/- causes increased support cell proliferation during homeostasis and regeneration.(A–B) Spatial analysis of amplifying (red squares), differentiation (green triangles) cell divisions and quiescent mantle cells (blue X’s) in sibling and fgf3-/- neuromasts during homeostasis. Quiescent and BrdU-positive cells from 18 neuromasts are superimposed onto the same X-Y plane. N.S. = not significant. (A’–B’’) Rose diagrams of the angular positions of BrdU(+) support cells (red) or hair cells (green) in sibling and fgf3-/- during homeostasis. D/V clustering and directional bias to the posterior was analyzed with a Binomial distribution test, *p<0.05, **p<0.008. (C–D) Spatial analysis of amplifying and differentiation cell divisions or quiescent mantle cells in sibling and fgf3-/- 24 hrs post neomycin. (C’–D’’) Rose diagrams of the angular positions of BrdU-positive support cells or hair cells in sibling or fgf3-/- 24 hrs post neomycin. D/V clustering and directional bias to the posterior was analyzed with a Binomial distribution test, ****p<0.00001, **p<0.008 (E) BrdU index of amplifying, differentiating and total cell divisions in sibling and fgf3-/- during homeostasis. Error bars show 95% CI. p-value determined by unpaired t-test, *p<0.03, **p<0.007. (F) BrdU index of amplifying, differentiating and total cell divisions in siblings and fgf3-/- mutants during 24 hrs post neomycin treatment. Error bars show 95% CI. p-value determined by unpaired t-test, ***p<0.0005, ****p<0.0001. (G–H) Alkaline phosphatase staining of sibling or fgfr1a-/-/fgfr2-/- at 5dpf. (I) Quantification of total neuromast cell number at 5dpf in siblings, fgfr2-/-, fgfr1a-/- and fgfr1a-/-/fgfr2-/-. Error bars show 95% CI. p-value determined by unpaired t-test, **p<0.007, ****p<0.0001. (J–K) Spatial analysis of all cell divisions (orange squares) or quiescent cells (grey X) in sibling or fgfr1a/fgfr2-/-during homeostasis. (L) EdU index of total cell divisions in siblings and fgfr1a/fgfr2-/- mutants during homeostasis. Error bars show 95% CI. p-value determined by unpaired t-test, *p=0.03. |

ZFIN is incorporating published figure images and captions as part of an ongoing project. Figures from some publications have not yet been curated, or are not available for display because of copyright restrictions. |
|
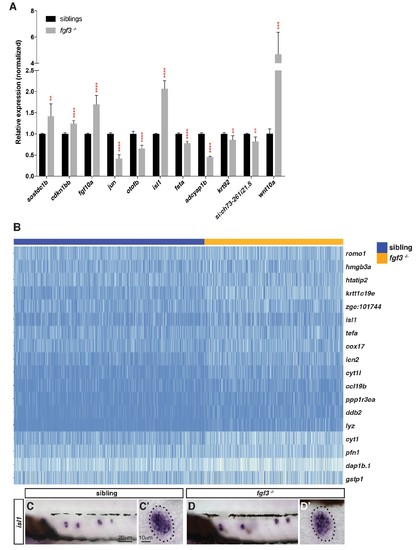
Selection of genes that are differentially expressed in fgf3 mutants.(A) RT-qPCR with candidate genes identified in the fgf3-/- scRNA-Seq analysis. Error bar: SD, t-test, **p<0.01, ***p<0.001, and ****p<0.0001. (B) Heatmap of genes upregulated in fgf3 mutant lateral line cells. (C–D’) In situ hybridization of isl1 that is slightly upregulated in fgf3-/-neuromasts. |

ZFIN is incorporating published figure images and captions as part of an ongoing project. Figures from some publications have not yet been curated, or are not available for display because of copyright restrictions. |


