- Title
-
An Attractive Reelin Gradient Establishes Synaptic Lamination in the Vertebrate Visual System
- Authors
- Di Donato, V., De Santis, F., Albadri, S., Auer, T.O., Duroure, K., Charpentier, M., Concordet, J.P., Gebhardt, C., Del Bene, F.
- Source
- Full text @ Neuron
|
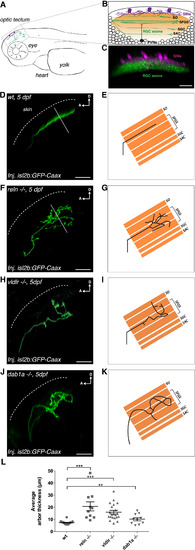
Genetic Loss of Function of Reelin Pathway Components Disrupts Synaptic Lamina Targeting of Retinal Ganglion Cell Axons in the Tectal Neuropil (A) Schematic lateral view of a 5 days post-fertilization (dpf) larva showing the anatomical localization of the optic tectum (inset). (B) Schematic lateral view of the optic tectum showing the relative positions of the major tectal cell populations. SINs, superficial inhibitory neurons (in purple); RGC axons, retinal ganglion cell axons (in green); PVNs, periventricular neurons (white ellipses, example monostratified PVN shown as black cell). The tectal neuropil, consisting predominantly of axons and dendrites, is shown in orange and can be further subdivided into four main layers: stratum opticum (SO), stratum fibrosum et griseum superficiale (SFGS), stratum griseum centrale (SGC), and stratum album centrale (SAC). (C) Lateral view of a confocal z-projection showing a 5 dpf Tg(s1156tEt; UAS:RFP) × Tg(Brn3C:mGFP) embryo displaying SINs in magenta (labeled by RFP) and RGC axons in green (labeled by mGFP). Scale bar, 20 μm. (D and E) Confocal reconstruction (D) and corresponding schematics (E) of one transiently isl2b:GFPCaax-labeled RGC axonal arbor in the tectum of a representative wild-type larva at 5 dpf shown from the side, parallel to the skin (dotted line), to highlight the RGCs’ laminar morphologies. The labeled RGC axon targets only a single neuropil lamina. Arbor thickness was measured using the fluorescence profile along a line perpendicular to the skin across the RGC arbor (solid white line, see STAR Methods). (F and G) Confocal reconstruction (F) and corresponding schematics (G) of a transiently GFP-labeled RGC axonal arbor in the tectum of a representative 5 dpf reln−/− larva highlighting the disruption of single lamina targeting. Arbor thickness was measured using the fluorescence profile along a line perpendicular to the skin across the RGC arbor (solid white line, see STAR Methods). (H and I) Confocal reconstruction (H) and corresponding schematics (I) of a transiently GFP-labeled RGC axonal arbor in the tectum of a representative 5 dpf vldlr−/− larva showing aberrant laminar targeting. (J and K) Confocal reconstruction (J) and corresponding schematics (K) of a transiently GFP-labeled RGC axonal arbor in the tectum of a representative 5 dpf dab1a−/− mutant larva spanning multiple laminae in the neuropil. (A–K) SO, stratum opticum; SFGS, stratum fibrosum et griseum superficiale; SGC, stratum griseum centrale; SAC, stratum album centrale; D, dorsal; A, anterior. Scale bars, 20 μm. (L) Average RGC arbor thickness in wild-type (n = 18 larvae, 37 RGCs total, mean arbor thickness per larva = 7.3 μm ± 0.3 μm SEM), reln−/− (n = 10 larvae, 22 RGCs in total, mean arbor thickness per larva = 20.7 μm ± 3.7 μm SEM), vldlr−/− (n = 21 larvae, 48 RGCs in total, average arbor thickness per larva = 16.0 μm ± 1.5 μm SEM), and dab1a−/− larva (n = 10 larvae, 28 RGCs in total, average RGC arbor thickness per larva = 10.2 μm ± 1.3 μm SEM). The average arbor thickness per larva was significantly larger in reln−/−, vldlr−/−, and dab1a−/− larvae compared to wild-type larvae, respectively (one-tailed two-sample t tests, wild-type < reln−/− p = 2.5e−05, wild-type < vldlr−/− p = 1.9e−06, wild-type < dab1a−/− p = 0.006). This suggests that genetic loss of function of components of the Reelin pathway disrupts the ability of retinal ganglion cell arbors to find their corresponding synaptic lamina in the tectum. Error bars represent mean ± SEM across larvae. ∗∗p < 0.01, ∗∗∗p < 0.001, one-tailed two-sample t test. See also Figures S1 and S2. EXPRESSION / LABELING:
|
|
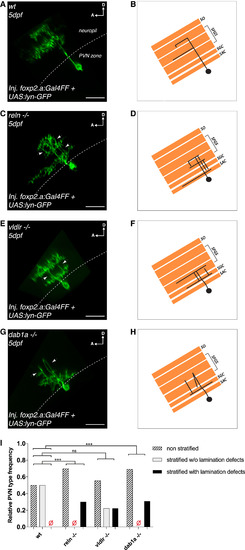
Genetic Loss of Function of Components of the Reelin Pathway Disrupts Lamination of Periventricular Neuron Arbors in the Tectal Neuropil (A and B) Confocal reconstruction (A) and corresponding schematics (B) of a transiently GFP-labeled bistratified PVN in the tectum of a 5 dpf wild-type larva shown from the side parallel to the skin (dotted line) to highlight the PVNs’ laminar morphology. Stratified PVNs did not show any lamination defects. A PVN was classified as displaying lamination defects if we could detect several arbor branches crossing multiple laminae per PVN. (C and D) Confocal reconstruction (C) and corresponding schematics (D) of a transiently GFP-labeled bistratified PVN in the tectum of a 5 dpf reln−/− larva highlighting aberrant PVN morphology. The white arrowheads indicate multiple branches atypically crossing distinct neuropil laminae. (E and F) Confocal reconstruction (E) and corresponding schematics (F) of a transiently GFP-labeled bistratified PVN in the tectum of a 5 dpf vldlr−/− larva showing aberrant PVN morphology. The white arrowheads indicate branches crossing different neuropil laminae. (G and H) Confocal reconstruction (G) and corresponding schematics (H) of a transiently GFP-labeled monostratified PVN in the tectum of a 5 dpf dab1a−/− larva showing aberrant PVN morphology. The white arrowheads indicate branches meandering across different neuropil laminae. (A–H) SO, stratum opticum; SFGS, stratum fibrosum et griseum superficiale; SGC, stratum griseum centrale; SAC, stratum album centrale; D, dorsal; A, anterior. Scale bars, 20 μm. (I) Frequency distribution of non-stratified PVNs, stratified PVNs without, or stratified PVNs with obvious lamination defects in wild-type (n = 14 PVNs from 13 larvae), reln−/− (n = 10 PVNs from 9 larvae), vldlr−/− (n = 9 PVNs from 8 larvae), and dab1a−/− (n = 13 PVNs from 13 larvae) at 5 dpf. Lamination defects of stratified PVNs were defined as the occurrence of several arbor branches originating from the cell body crossing multiple neuropil laminae. PVN frequency distributions were significantly different in reln−/− and dab1a−/− larvae compared to wild-type larvae, respectively (k × 2 chi-square test after Brandt-Snedecor, wild-type versus reln−/− p = 0.0082, wild-type versus dab1a−/− p = 0.0036), whereas there was no significant difference observed between wild-type and vldlr−/− (p = 0.12). These data suggest that genetic loss of function of components of the Reelin pathway also disrupt the ability of PVNs to target single synaptic lamina in the tectum. See also Figure S3. |
|
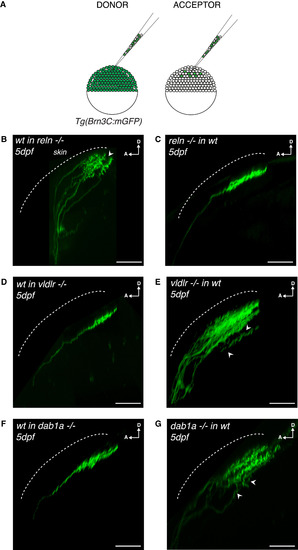
Tectum-Derived Reelin and RGC-Derived VLDLR/Dab1a Regulate the Establishment of RGC Synaptic Laminae in the Tectal Neuropil (A) Schematics of blastula transplants from RGC-specific Tg(Brn3c:mGFP) donors supplying acceptor embryos of varying genotypes with green-labeled RGCs of donor genotype. (B) Side view of RGC axons at 5 dpf after blastula stage transplantations from a wild-type donor into a reelin mutant acceptor. Aberrant laminations (white arrowhead) were detected in all larvae analyzed (n = 8/8). (C) Side view of a RGC axon in the tectal neuropil at 5 dpf after blastula stage cell transplantation from a reelin mutant donor into a wild-type acceptor. No synaptic lamination defects were detected in all larvae analyzed (n = 0/12), suggesting that tectum-derived Reelin and not Reelin expressed by RGCs controls single synaptic lamina targeting. (D) Side view of a RGC axon in the tectal neuropil at 5 dpf after blastula stage cell transplantation from a wild-type donor into a vldlr−/− acceptor. No synaptic lamination defects were observed in analyzed larvae (n = 0/6). (E) Side view of RGC axons in the tectal neuropil at 5 dpf after blastula stage cell transplantation from a vldlr−/− mutant donor into a wild-type acceptor. Aberrant laminations (white arrowhead) were detected in most larvae (n = 5/10), suggesting that vldlr expressed by RGCs influences single lamina targeting by RGCs. In (A)–(E), scale bars, 30 μm. D, dorsal; A, anterior. (F) Side view of a RGC axon in the tectal neuropil at 5 dpf after blastula stage cell transplantation from a wild-type donor into a dab1a−/− acceptor. No synaptic lamination defects were observed in analyzed larvae (n = 0/7). (G) Side view of RGC axons in the tectal neuropil at 5 dpf after blastula stage cell transplantation from a dab1a−/− mutant donor into a wild-type acceptor. Aberrant laminations (white arrowheads) were detected in most larvae (n = 5/9), suggesting that dab1a expressed by RGCs is involved in single lamina targeting by RGCs. |
|
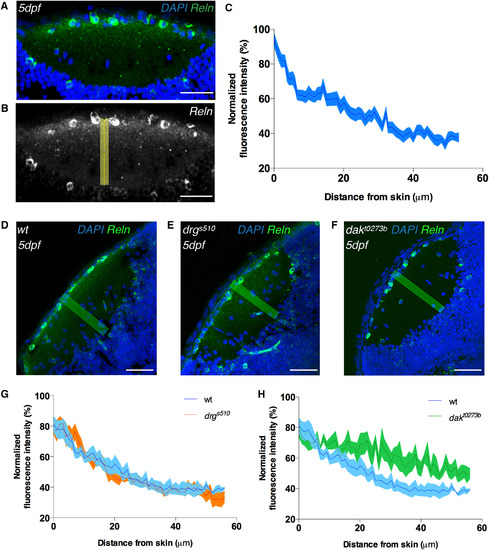
A Superficial-to-Deep Reelin Gradient Is Present in the Tectal Neuropil and Requires Heparan Sulfate Proteoglycans for Its Stabilization in the ECM (A) Immunostaining of anti-reelin (green) and DAPI (blue) on a horizontal cryo-section through a 5 dpf larval tectum. Reelin protein accumulates at the basement membrane (i.e., the tectal surface), and its concentration decreases perpendicular to the laminae in the neuropil toward the periventricular zone, where the cell bodies of PVNs reside. Scale bar, 30 μm. (B) Grayscale image of anti-reelin staining shown in (A) and the rectangle in yellow along which the Reelin gradient was measured. Scale bar, 30 μm. (C) Densitometric plot of normalized anti-reelin fluorescence in 5 dpf wild-type tecta showing a superficial-to-deep Reelin gradient. Data are represented as mean ± SEM, calculated from four samples out of four independent experiments. Reelin was also expressed in a few PVNs (see A and B), but this did not seem to cause any detectable disturbance of the Reelin gradient in the deep neuropil laminae. (D–F) Spatial distribution of Reelin protein in cryo-sectioned tecta of 5 dpf wild-type (D), drgs510 (type IV collagen LOF) (E), and dakt0273b (exostosin-2 LOF, glycosyltransferase involved in the heparan sulfate proteoglycans synthesis) (F) larvae. Anti-reelin staining is shown in green and DAPI counterstaining in blue. The yellow rectangles indicate along which direction the Reelin gradients for (G) and (H) were measured. Scale bars, 30 μm. (G) Densitometric plots of normalized anti-reelin fluorescence intensity taken from wild-type and drgs510 tecta. Data are represented as mean ± SEM, calculated from five samples per genotype. No difference in Reelin gradient distribution was seen between wild-type and drgs510 larvae. (H) Densitometric plots of normalized anti-reelin fluorescence intensity taken from wild-type and dakt0273b tecta (see D and F). Data are represented as mean ± SEM, calculated from five samples per genotype. A difference in Reelin gradient distribution was seen between wild-type and dakt0273b larvae, suggesting that heparan sulfate proteoglycans are required for Reelin gradient stabilization in the tectum. See also Figure S4. |
|
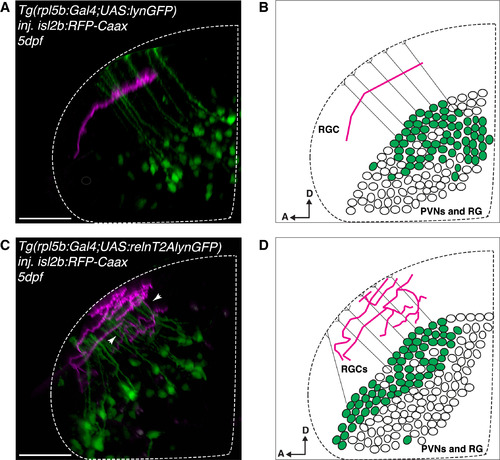
Ectopic Reelin Expression in Periventricular Neurons and Radial Glia Causes Perturbations of Single Laminae Targeting of RGCs in the Tectal Neuropil (A) Lateral projection of a representative confocal stack showing a single RGC axon genetically labeled with isl2b:RFP (magenta) in the tectum of a larva expressing the rpl5b:Gal4;UAS:GFP transgene (control), which is active in a subset of PVNs and radial glia cells (RGs) (green). All analyzed RGCs targeted a single lamina (n = 17/17 fish). Scale bar, 35 μm. (B) Schematics of a single RGC axon targeting a distinct lamina in the tectal neuropil of a 5 dpf larva expressing GFP (control) in a subset of PVNs and RGs (green), thus spatially opposite of the superficial Reelin-enriched neuropil zone (as in A). PVNs, periventricular neurons; RG, radial glia cells; D, dorsal; A, anterior. (C) Lateral projection of a representative confocal stack showing multiple isl2b:RFP-labeled RGC axons (magenta) in the tectum of a Tg(rlp5b:Gal4;UAS:relnT2AlynGFP) larva allowing the co-expression of mouse reelin and membrane-GFP in a subset of PVNs and RGs (green). RGC axons meander between multiple laminae (white arrowheads, altered lamination pattern observed in n = 11/19 larvae), thus suggesting that ectopic reeln expression is interfering with the endogenous graded Reelin distribution. Scale bar, 35 μm. (D) Schematics of multiple RGC axons in the tectal neuropil of a 5 dpf larva expressing relnT2AlynGFP in a subset of PVNs and RGs (green), thus spatially opposite of the superficial Reelin-enriched neuropil zone (as in C). PVNs, periventricular neurons; RGs, radial glia cells; D, dorsal; A, anterior. See also Figure S5. |
|
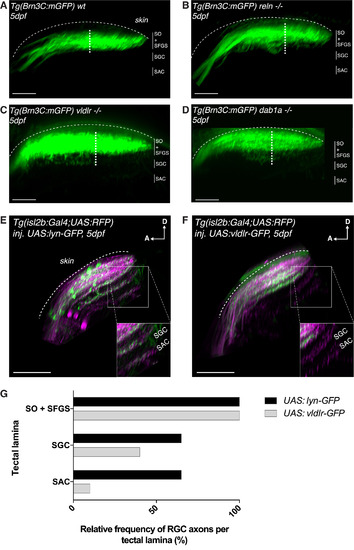
The Reelin Gradient Is a Chemoattractant for Retinal Afferents during Laminar Targeting (A) Side view of the retinotectal projection of a 5 dpf wild-type larva expressing the Tg(Brn3c:mGFP) transgene that labels exclusively RGC axonal arbors targeting the two most superficial layers (SO and SFGS), but not the deep layers (SAC and SGC), of the tectal neuropil. As the most superficial SO layer is usually hard to distinguish from the more prominent SFGS, the thickness of the projection was measured by taking the distance between the most superficial and the deepest visible axonal branch (white dotted line). The average thickness of the RGC projection in wild-type larvae was 25.8 μm ± 0.6 μm SEM (n = 17 larvae). Scale bar, 30 μm. (B) Side view of the retinotectal projection of a 5 dpf reln−/− larva labeled by the Tg(Brn3c:mGFP) transgene. RGC branches were shifted to deep layers in the tectal neuropil, which is reflected by an increase in overall RGC projection thickness in reln−/− (32.3 μm ± 1.5 μm SEM, n = 8 larvae) compared to wild-type larvae (one-tailed two-sample t tests, p = 2.9e−05). Scale bar, 30 μm. (C) Side view of the retinotectal projection of a 5 dpf vldlr−/− larva labeled by the Tg(Brn3c:mGFP) transgene. RGC branches unusually projected to deep layers in the tectal neuropil as indicated by an increase in RGC projection thickness in vldlr−/− (32.3 μm ± 1.5 μm SEM, n = 7 larvae) compared to wild-type larvae (one-tailed two-sample t tests, p = 2.2e−05). Scale bar, 30 μm. (D) Side view of the retinotectal projection of a 5 dpf dab1a−/− larva labeled by the Tg(Brn3c:mGFP) transgene. RGC branches extended to deep layers in the tectal neuropil as indicated by an increase in RGC projection thickness in dab1a−/− (32.8 μm ± 1.4 μm SEM, n = 7 larvae) compared to wild-type larvae (one-tailed two-sample t tests, p = 4.5e−06). Scale bar, 30 μm. (E) Side view of the retinotectal projection of a 5 dpf larva expressing the Tg(isl2b:Gal4;UAS:RFP) transgene that labels the entire RGC population targeting all four main layers (SO, SFGS, SAC, and SGC) of the tectal neuropil (magenta). Membrane-targeted lyn-GFP is transiently expressed as a control in a mosaic subset of these RGCs. The inset highlights the neuropil area, where the deep neuropil layers, SGC and SAC, can be easily identified. Higher magnification of this inset shows axonal targeting within the deep neuropil layers by GFP-positive control RGCs. D, dorsal; A, anterior. Scale bar, 35 μm. (F) Side view of the retinotectal projection showing the entire RGC population (magenta) in 5 dpf larva expressing Tg(isl2b:Gal4;UAS:RFP). In addition vldlr-GFP is transiently expressed in a mosaic subset of RGCs. We expected these GFP-positive RGCs to be more sensitive to endogenous Reelin. Higher magnification of the inset shows the absence of vldlr-overexpressing RGCs in the deep layers of the tectal neuropil. D, dorsal; A, anterior. Scale bar, 35 μm. (G) Quantification (see E and F) showing the percentage of larvae displaying one or more GFP-labeled RGC axons in the main layers of the tectal neuropil (n = 20 UAS:lyn-GFP-expressing larvae; n = 20 UAS:vldlr-GFP-expressing larvae). The superficial layers SO and SFGS were merged and scored together, as their close proximity makes their discrimination in isl2b:Gal4 larvae difficult. RGCs overexpressing vldlr-GFP target the deep neuropil layers at a much lower frequency compared to RGCs expressing lyn-GFP (ctrl), suggesting that the former preferentially targets Reelin-enriched superficial neuropil layers. (A–G) SO, stratum opticum; SFGS, stratum fibrosum et griseum superficiale; SGC, stratum griseum centrale; SAC, stratum album centrale; SPV, stratum periventriculare. |
|
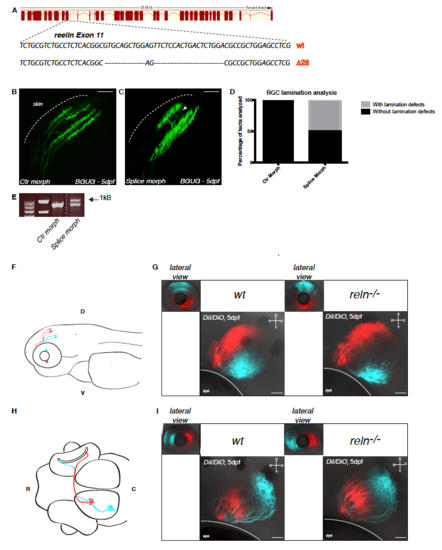
Confirmation of the axonal lamination phenotype by antisense spliceblocking morpholino oligonucleotides against Reelin and analysis of retinotopic organization in Reelin mutant larvae. Related to Figure 1. (A) Schematics of TALEN-mediated gene disruption at the reelin locus. The targeting of the gene induced a deletion of 28 base pairs (bp) in the reelin genomic locus leading to the generation of a premature STOP codon as described in Supplemental Table S1. (B, C) Lateral projections of confocal stacks of the BGUG transgenic line, which is used to mosaic-label RGCs with GFP, that were injected with control (B) or reelin spliceblocking morpholino oligonucleotides (C). The white arrowhead in (C) indicates aberrant laminar targeting never observed in wild-type larvae. Scale bar = 20 μm. (D) Quantification of the percentage of tecta with or without lamination defects in control (n=23/23) or splice-blocking morpholino (n=16/32) injected larvae. (E) RT-PCR on cDNA extracted from 48dpf larvae injected with control morpholino or splice-blocking morpholino. The presence of an upper band in the splice-blocking morpholino-injected samples is the consequence of the retention in the transcript of the intron 12. The two first lanes indicate molecular markers. (F) Lateral schematic view of a zebrafish larva highlighting dorso-ventral retinotopic targeting in the tectum. Axons from RGCs located in the dorsal retina terminate in the ventral tectal neuropil whereas axons from RGCs residing in the ventral retina project to the dorsal tectal neuropil. D = dorsal, V = ventral. (G) Injections of lipophilic dyes DiI (red) and DiO (cyan) in dorsal and ventral quadrants of the contralateral retina show that retinotopic mapping to the optic tectum is not altered in reelin mutants (right panel) compared to wild-type embryos (left panel). D = dorsal, V = ventral, R = rostral, C = caudal. Scale bar = 30 μm. (H) Dorsal schematic view of a zebrafish larva highlighting rostro-caudal retinotopic targeting in the tectum. Axons from RGCs located in the rostral retina terminate in the caudal tectal neuropil whereas axons from RGCs residing in the caudal retina project to the rostral tectal neuropil. R = rostral, C = caudal. (I) Injections of lipophilic dyes DiI (red) and DiO (cyan) in rostral and caudal quadrants of the contralateral retina show that retinotopic mapping to the optic tectum is not altered in reelin mutants (right panel) compared to wild-type embryos (left panel). D = dorsal, V = ventral, R = rostral, C = caudal. Scale bar = 30 μm. |
|
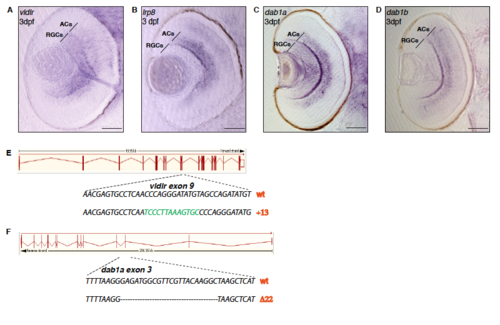
Expression patterns and gene disruption of Reelin signaling pathway members. Related to Figure 1. (A) Cross-section of a 3 dpf zebrafish retina showing mRNA expression of the Reelin receptor vldlr in RGC and amacrine cell (AC) populations. Scale bar = 40 μm. (B) Cross-section of a 3 dpf zebrafish retina showing mRNA expression of the Reelin receptor lrp8 in amacrine cells but not in RGCs. Scale bar = 40μm. (C) Cross-section of a 3 dpf zebrafish retina showing mRNA expression of an intracellular transducer downstream of vldlr, dab1a, in RGCs and ACs. Scale bar = 40 μm. (D) Cross-section of a 3 dpf zebrafish retina showing mRNA expression of the dab1aparalog dab1b in amacrine cells but not in RGCs. Scale bar = 40μm. (E) Schematics of CRISPR/Cas9-mediated gene disruption at the vldlr genomic locus. The targeting of the gene induced an insertion of 13 bp in the vldlr gene leading to the generation of a premature STOP codon as described in Supplemental Table S1. (F) Schematics of CRISPR/Cas9-mediated gene disruption at the dab1a genomic locus. The targeting of the gene induced a deletion of 22 bp in the dab1a gene leading to complete rearrangement of the genomic sequence as described in Supplemental Table S1. EXPRESSION / LABELING:
|
|
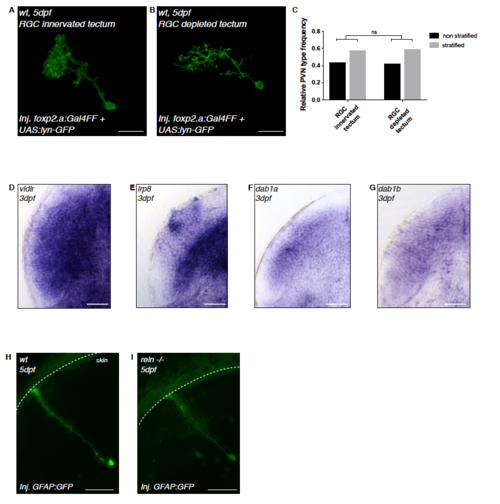
PVN stratification in eyeless larvae and Reelin signaling pathway member expressions in PVNs. Related to Figure 2. (A) Confocal image of a transiently GFP-labeled PVN in an RGC-innervated tectum at 5dpf shown from the side, parallel to the skin to highlight the PVNs’ stratified laminar morphology. (B) Confocal image of a transiently GFP-labeled PVN in an RGC-depleted tectum at 5dpf shown from the side, parallel to the skin to highlight the PVNs’ stratified laminar morphology. (C) Frequency distribution of non-stratified PVNs and stratified PVNs without lamina targeting mistakes at 5-6dpf in RGC-depleted tecta (n=7 larvae) and the tectum of larvae of which the corresponding eye was removed at 2 dpf (n=12 larvae). We could not observe any difference between the two groups (k*2-chi-square test after Brandt-Snedecor, p = 0.9596) thus suggesting that PVN lamination defects seen in reln -/-, vldlr -/-,/sup> and dab1a -/- are not a consequence of prior RGC mis-targeting but are better explained by PVNs using Reelin signaling as guidance signal to identify single target lamina. (D) Horizontal cross-section of a 3 dpf zebrafish tectum showing strong mRNA expression of the Reelin receptor vldlr in PVNs. (E) Horizontal cross-section of a 3 dpf zebrafish tectum showing strong mRNA expression of the Reelin receptor lrp8 in PVNs. (F) Horizontal cross-section of a 3 dpf zebrafish tectum showing mRNA expression of dab1a, an intracellular transducer downstream of Reelin receptors, in PVNs. (G) Horizontal cross-section of a 3 dpf zebrafish tectum showing mRNA expression of dab1b, a paralog of dab1a, in PVNs. (H-I) Confocal reconstruction of radial glia cells transiently labeled with the GFAP:GFP construct. Radial glia span the entire depth of the larval zebrafish tectum, from the ventricular region to the surface of the tectal neuropil (white dashed line) in both wild-type (n=6) and reln -/- (n=6) larvae at 5 dpf, suggesting that radial fibers are not contributing to layer-specific guidance of RGC axons by Reelin. EXPRESSION / LABELING:
|
|
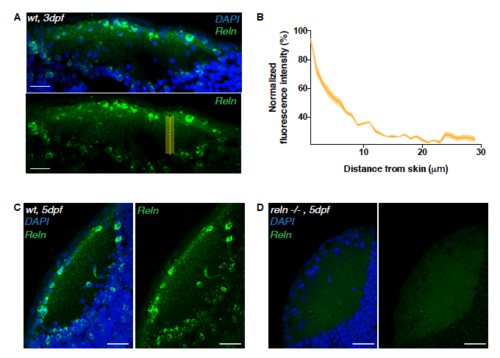
Reelin immunoreactivity in the neuropil of 3 dpf reln-/- larvae. Related to Figure 4. (A) Immunostaining of anti-reelin (green) and DAPI (blue) on a horizontal cryosection of a 3 dpf larval tectum. Scale bar = 20μm. The yellow rectangle indicates the long-axis along which the Reelin gradient in (B) was measured. (B) Densitometric plot of normalized anti-reelin fluorescence intensity taken from 3 different tecta at 3dpf. Data are represented as mean ± s.e.m. (C, D) Horizontal sections of 5dpf tectum showing reelin spatial distribution detected wildtype larva (C) or a reln-/- mutant (D). The reelin protein is absent in the mutant. Scale bars = 30 μm. EXPRESSION / LABELING:
PHENOTYPE:
|
|
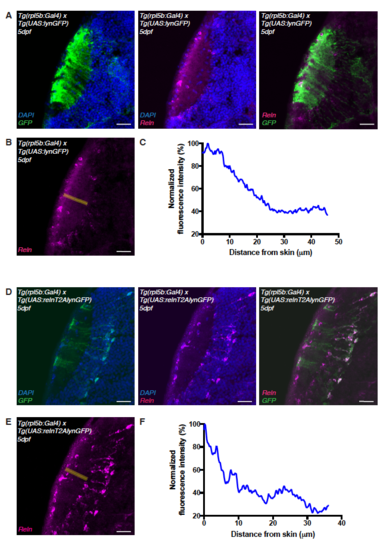
Ectopic expression of reelin in the tectum. Related to Figure 5. (A) Immunostaining of anti-reelin (magenta), anti-GFP (green) and DAPI (blue) on a horizontal cryo-section through the tectum of 5 dpf Tg(rpl5b:Gal4, UAS:lynGFP) transgenic larva expressing membrane tagged lyn-GFP in PVNs and radial glia cells. (B) Anti-reelin staining shown in (A) and the rectangle in yellow along which the Reelin gradient was measured. (C) Densitometric plot of normalized anti-reelin fluorescence intensity taken from tecta expressing GFP indicating that endogenous reelin expression is unaffected by GFP expression (ctrl). (D) Immunostaining of anti-reelin (magenta), anti-GFP (green) and DAPI (blue) on a horizontal cryo-section through the tectum of 5 dpf larva expressing the rpl5b:Gal4; UAS:relnT2AGFP transgenes in PVNs and radial glia cells. Reelin protein is present in PVNs and RG cells expressing the UAS:relnT2AGFP transgene as shown by co-labeling of Reelin and GFP (right panel). (E) Anti-reelin staining shown in (D) and the rectangle in yellow along which the Reelin gradient was measured. (F) Densitometric plot of normalized anti-reelin fluorescence intensity taken from tecta ectopically expressing relnT2AGFP. The overall superficially high to deep low gradient distribution seen in the ctrl seems to be intact however local perturbations of the gradient were observed. Scale bars = 25 μm. |
|
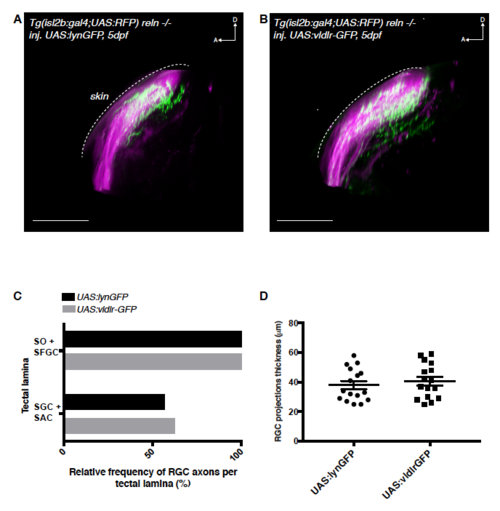
Reelin gradient is required for VLDLR-mediated chemoattraction of retinal afferents during laminar targeting. Related to Figure 6 (A) Side-view of the retinotectal projection of a 5 dpf reln -/- larva expressing the Tg(isl2b:Gal4;UAS:RFP) transgene that labels the entire RGC population (magenta). Membrane-targeted lyn-GFP is transiently expressed as a control in a mosaic subset of these RGCs. D = dorsal; A = anterior. Scale bar = 35 μm. (B) Side-view of the retinotectal projection showing the entire RGC population (magenta) in 5 dpf reln -/- larva expressing Tg(isl2b:Gal4;UAS:RFP). In addition vldlr-GFP is transiently expressed in a mosaic subset of RGCs. In the absence of reelin expression VLDLR overexpressing cells are able to target the deeper SGC and SAC layers with the same frequency than control cells. D = dorsal; A = anterior. Scale bar = 35 μm. (C) Quantification (see A and B) showing the percentage of larvae displaying one or more GFP-labeled RGC axons in the main layers of the tectal neuropil (n=16 UAS:lyn-GFP expressing larvae; n=16 UAS:vldlr-GFP expressing larvae). The superficial layers SO and SFGS were merged and scored together, as their close proximity makes their discrimination in isl2b:Gal4 larvae difficult. In addition, because of the targeting mistakes seen in 5 dpf reln -/- larva RGCs, SGC and SAC layers were also merged and scored together as their distinction was uncertain in this mutant background. RCGs overexpressing vldlr-GFP target the deep neuropil layers at a similar frequency compared to RGCs expressing lyn-GFP (ctrl) suggesting in the absence of Reelin, VLDLR has no effect on layer preference. SO, stratum opticum; SFGS, stratum fibrosum et griseum superficiale; SGC, stratum griseum centrale; SAC, stratum album centrale; SPV, stratum periventriculare. (D) Quantification (see A and B) of RGC projection thickness. Since layer assignment is more difficult in 5 dpf reln -/- larvae, we scored the phenotype as the total thickness of the projection as measured by taking the distance between the most superficial and the deepest visible axonal branch. The average thickness of the RGC projection in reln -/- larvae was 38.0 μm ± 2.8 μm s.e.m (n=16 larvae) for UAS:lynGFP expressing RGCs and 40.6 μm ± 2.9 μm s.e.m (n=16 larvae) for UAS:vldlr-GFP expressing RGCs. |
|
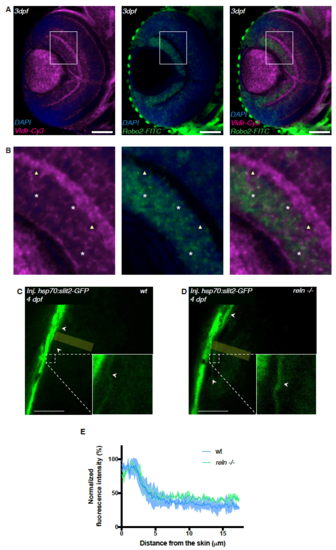
vldlr and robo2 expression in RGCs of the developing retina and Slit distribution in the tectum. Related to Figure 7. (A) Confocal cross-section of a 3 dpf zebrafish retina showing mRNA expression of the Reelin receptor vldlr (magenta) and robo2 (green) in RGCs. Scale bars = 50 μm. (B) Insets as indicated in (A) showing mostly an overlap of vldlr and robo2 expression in RGCs (white asterisk) consistent with a model according to which RGCs integrate both Reelin and Slit signals to identify the single target lamina in the tectum. In a few RGCs we could only detect vldlr (white triangles) possibly owing to the in situ probe not being sensitive enough to pick up on low amounts of the robo2 mRNA. (C) Confocal section through the tectum of a 4dpf wild-type larva injected with hsp70:slit2- GFP at one-cell stage and heat-shocked at 76 hpf. Slit2-GFP (green) is enriched at the surface of the tectal neuropil (arrows). The yellow rectangle indicates the dimension along which the slit signal was measured. Scale bar = 30μm (D) Confocal section through the tectum of a 4dpf reln -/- larva injected with hsp70:slit2-GFP at one-cell stage and heat-shocked at 76 hpf. Slit2-GFP (green) is enriched at the surface of the tectal neuropil (arrows). The yellow rectangle indicates the dimension along which the slit signal was measured. Scale bar = 30μm (E) Densitometric plots of normalized GFP fluorescence intensity in 4 dpf wild-type (along yellow rectangle in C) and reln -/- (along yellow rectangle in D) tecta. Slit2-GFP localization in the neuropil is indistinguishable between wild-type and reln -/- tecta. EXPRESSION / LABELING:
|

