
- Title
-
The heterochronic genes lin-28a and lin-28b play an essential and evolutionarily conserved role in early zebrafish development
- Authors
- Ouchi, Y., Yamamoto, J., and Iwamoto, T.
- Source
- Full text @ PLoS One
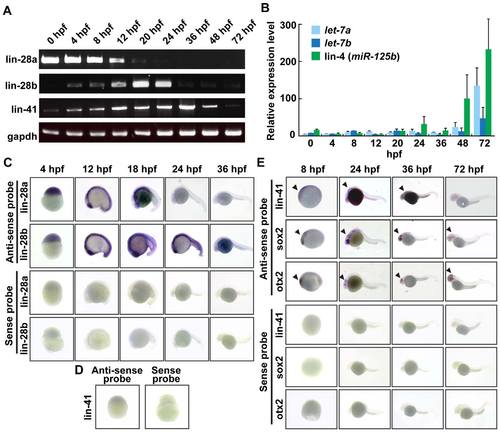
Expression patterns of zebrafish heterochronic genes during embryonic development. A. Semiquantitative RT-PCR analysis of lin-28a, lin-28b... show more A. Semiquantitative RT-PCR analysis of lin-28a, lin-28b and lin-41 gene mRNA expression. Total RNA was isolated from wild-type embryos at the indicated developmental stages and analyzed by using specific primers for lin-28a, lin-28b and lin-41. gapdh was used as a control. B. Real-time PCR analysis of let-7a, let-7b and lin-4/miR-125b miRNA expression. Total RNA was isolated from wild-type embryos at the indicated developmental stages. Expression levels of let-7a, let-7b and lin-4/miR-125b was analyzed using TaqMan miRNA assay. C. Developmental expression analysis of zebrafish lin-28a and lin-28b mRNAs by whole mount in situ hybridization. Zebrafish embryos at various stages were hybridized with antisense probes. D, E. Developmental expression analysis of zebrafish lin-41 mRNAs by whole mount in situ hybridization. sox2 and otx2 probes were used as a CNS maker. Arrowhead indicated expression in the CNS. EXPRESSION / LABELING:
|
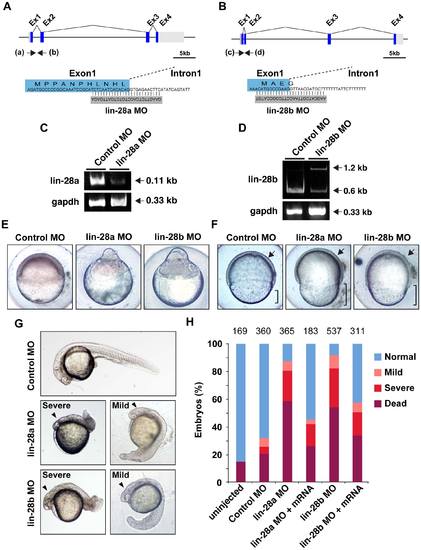
Morpholino-mediated knockdown of lin-28a and lin-28b affects early development. A. B. Schematic representation shows the genomic organization of the lin-28a and lin-28b genes in zebrafish. Regions targeted by splice-blocking morpholinos are shown. Arrows depict the location of the two primer sets to amplify exon and intron sequences, which were utilized in the RT-PCR analysis. C. D. The efficacy of MO was validated by RT-PCR using primers as indicated in A, B. Total RNA was isolated from lin-28a, lin-28b or control MO-injected embryos at 5 hpf and analyzed by using specific primers for lin-28a and lin-28b. Upper panel shows a reduced expression of lin-28a and lin-28b mRNA, and an increase of an aberrantly spliced lin-28b transcripts corresponding to the presence of intron 1. Lower panel shows RT-PCR products with gapdh primers used as internal control. E. Representative images of severe phenotype of lin-28a and lin-28b morphants at 5 hpf. F. Vegetal view of control, lin-28a and lin-28b morphants at 8 hpf. Arrow shows the similar extent of prechordal plate extension in control, lin-28a and lin-28b morphant embryos; bracket shows a reduced extent in epiboly in lin-28a and lin-28b morphant embryos compared with controls. G. Representatives of mild and severe phenotypes in lin-28a and lin-28b morphants at 30 hpf. Both lin-28a and lin-28b morphants develop morphological phenotypes displaying shorten body axis, small anterior structures and aberrant tail morphology ranging from mild (Right) to severe (Left) compare to control MO injected embryos (Top). Arrowheads indicate the smaller head. H. Quantification of the efficiency of rescue from gastrulation defects following co-injection of lin-28a MO, lin-28b MO and mRNAs. More than half of the lin-28a MO or lin-28b MO injected embryos had died by 30 hpf. The frequencies of the phenotypes were similar between lin-28a and lin-28b morphants. The frequency of the dead, mild and severe phenotypes decreased with a rescue experiment in which 300 pg of lin-28a and lin-28b mRNAs were co-injected with the MO. (p<0.0001, lin-28a MO vs. lin-28a MO+lin-28a mRNA, lin-28b MO vs. lin-28b MO+lin-28b mRNA, Fisher’s exact test). The total number of embryos is noted above each bar. PHENOTYPE:
|
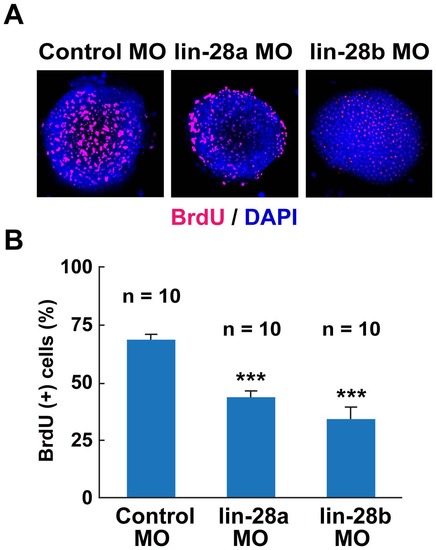
Effect of lin-28a and lin-28b knockdown on cell proliferation. A. Confocal images of BrdU (Red) incorporation in lin-28a and lin-28b morphant embryos at 5hpf. Both lin-28a and lin-28b MO-injected embryos were exposed to BrdU at 4 hpf for 1 hour. The nuclei were stained with DAPI (blue). B. Percentage of BrdU incorporated cells in lin-28a and lin-28b morphants embryos. The percentage of BrdU-incorporated cells was calculated by dividing the number of BrdU-positive cells by the total number of cells as determined by DAPI-stained cells. The percentage of BrdU-positive cells was significantly lower in both lin-28a MO- and lin-28b MO-injected embryos compared with control MO-injected embryos (***p<0.001, control MO vs. lin-28a MO, control MO vs. lin-28b MO, two-tailed test, n = 10, mean ± SEM). EXPRESSION / LABELING:
PHENOTYPE:
|
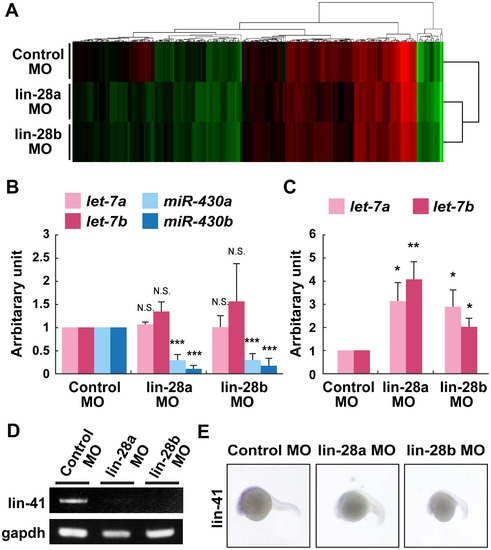
Expression of miRNAs and downstream heterochronic genes in lin-28a and lin-28b morphant embryos. A. miRNA expression profiling in lin-28a and lin-28b morphants embryos at 5 hpf. Hierarchically clustered heat-map representing differences in miRNA expression between control MO-injected embryos and lin-28a MO- or lin-28b MO-injected embryos. Relative levels of expression are colored from green (low) to red (high). B. Real-time PCR analysis of let-7a, let-7b, miR-430a and miR-430b expression in control MO-, lin-28a MO- and lin-28b MO-injected embryos. Expression levels of let-7a, let-7b, miR-430a and miR-430b were analyzed at 5 hpf using TaqMan miRNA assay. The expression level of miR-430a and miR-430b was downregulated in both lin-28a MO- and lin-28b MO-injected embryos compared with control MO-injected embryos (***p<0.001, control MO vs. lin-28a MO, control MO vs. lin-28b MO, two-tailed test, n = 3, mean ± SEM). C. Real-time PCR analysis of let-7a and let-7b expression in control MO-, lin-28a MO- and lin-28b MO-injected embryos. Expression levels of let-7a and let-7b were analyzed using TaqMan miRNA assay at 28 hpf. The expression level of let-7a and let-7b was increased in both lin-28a MO- and lin-28b MO-injected embryos embryos compared with control MO-injected embryos (*p<0.05, **p<0.01, control MO vs. lin-28a MO, control MO vs. lin-28b MO, two-tailed test, n = 4, mean ± SEM). D. Semiquantitative RT-PCR analysis of lin-41 gene expression in control MO-, lin-28a MO- and lin-28b MO-injected embryos. Total RNA was isolated from lin-28a MO-, lin-28b MO- or control MO-injected embryos at 24 hpf and analyzed by using specific primers for lin-41. The expression of lin-41 was decreased in both lin-28a MO- and lin-28b MO-injected embryos compared with control MO-injected embryos. E. Control, lin-28a and lin-28b MO-injected embryos labeled by in situ hybridization with lin-41 probe. Expression of lin-41 was repressed in CNS of both lin-28a and lin-28b morphant embryos at 24 hpf. |

Unillustrated author statements PHENOTYPE:
|