- Title
-
Chemokine GPCR Signaling Inhibits β-Catenin during Zebrafish Axis Formation
- Authors
- Wu, S.Y., Shin, J., Sepich, D.S., and Solnica-Krezel, L.
- Source
- Full text @ PLoS Biol.
|
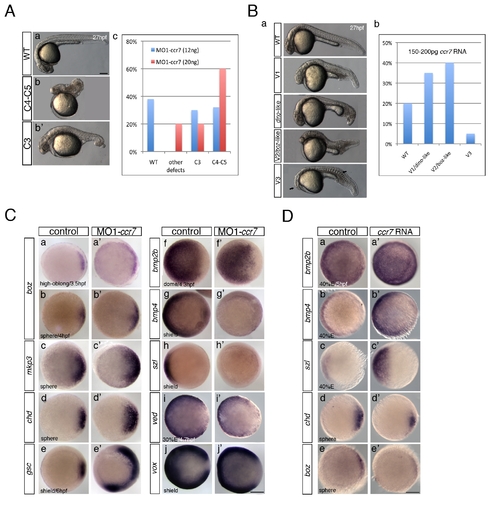
Ccr7 is required for proper AP and DV embryo patterning. (A) The spectrum of dorsalized phenotypes in embryos injected with MO1-ccr7 at 27 hpf, ranging from highly dorsalized (C4–5; b) with truncated tails and trunks to C3 with tail deficiencies (b2) (total n = 190, seven independent experiments for 12 ng MO1-ccr7 and n = 35, one experiment for 20 ng MO1-ccr7). The frequency of each phenotypic category is indicated in the right panel (c). The scale bars represent 200 μm in all figures. (B) Ccr7 overexpression (150–200 pg RNA) caused a spectrum of ventralized phenotypes, ranging from V3 to V1 (arrows show anterior and notochord deficiencies) to WT-like (a). The frequency of each phenotypic category is indicated in the right panel (b; n = 96, two experiments). (C) Expression of dorsal/ventral markers in Ccr7 morphants compared to control embryos revealed by WISH. (a–e2) Expression of dorsal genes was upregulated or expanded: at high-oblong stage (3.3–3.7 hpf), boz, n = 8/8; at sphere stage (4 hpf), boz, n = 16/28; mkp3, n = 9/12; chd, n = 11/15; at shield stage (6 hpf), gsc, n = 18/37. (f–j2) Expression of ventral genes was reduced: at dome (4.3 hpf) stage, bmp2b, n = 19/24; at 30% epiboly stage (4.7 hpf), ved, n = 12/14; at shield stage, bmp4, n = 9/10; szl, n = 11/12; vox, n = 16/22. Animal views, dorsal to the right. (D) Expression of dorsal/ventral markers in Ccr7-overexpressing embryos revealed by WISH. Expression of ventral markers was expanded (a–c2), while dorsal markers were decreased (d–e2): at sphere stage, boz, n = 8/8; chd, n = 10/13; at 40% epiboly stage (5 hpf), bmp2b, n = 12/12; bmp4, n = 14/14; szl, n = 13/13. Animal views, dorsal to the right. |
|
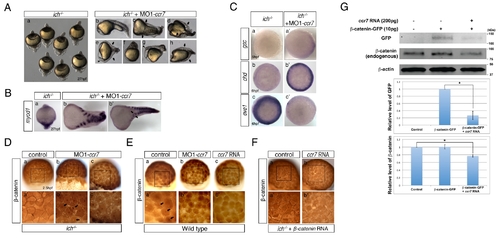
Depletion of Ccr7 activity partially rescues axis formation in ichabod mutants. (A) Penetrance of strongly ventralized phenotypes displayed by maternal β-catenin-2, ich, mutant embryos (a, 92%, n = 110) was reduced by injection of MO1-ccr7 (b–h, 10 ng; 40%, n = 98, five experiments). Arrows indicate partial axes and arrowheads indicate rudimentary head structures. (B) myod1 expression in uninjected (a) and MO1-ccr7-injected ich embryos (b,b2) revealed somitic tissue. Arrows indicate partial double axes. (C) In contrast to uninjected ich mutants (a,b,c), in MO1-ccr7-injected ich embryos, the organizer genes gsc (a2, n = 11/12) and chd (b2, n = 8/8) were expressed; while expression of the ventral gene, eve1, was significantly reduced (c2, n = 30/40). Animal views. (D) Lack of β-catenin nuclear accumulation, detected by immunostaining at 256-cell stage, in ich mutants (a), was suppressed in MO1-ccr7-injected ich embryos (b,c; n = 9/10, two experiments). (a2–c2) Higher magnification of boxed areas in a–c. (E) Dorsal domain of nuclear accumulation of β-catenin, detected by immunostaining at 256-cell stage in WT embryos (a), was expanded in ccr7 morphants (b; n = 6/13), while it was diminished in Ccr7 overexpressing embryos (c; n = 8/11). (a2–c2) Higher magnification of boxed areas in a–c. (F) Ectopic β-catenin nuclear accumulation, detected by immunostaining at 256–512-cell stage, in ich mutants injected with β-catenin RNA (a; 25 pg, n = 9/10), was suppressed by co-injecting ccr7 RNA (b; 150 pg, n = 7/10). (a2–b2) Higher magnification of boxed areas in a–b. (G) Ccr7 gain-of-function decreased both levels of endogenous β-catenin and ectopic β-catenin-GFP. Western blotting of β-catenin and GFP protein from uninjected control, β-catenin-GFP RNA (10 pg) injected, or β-catenin-GFP RNA (10 pg)/ccr7 RNA (200 pg) co-injected embryos (all at 3–3.3 hpf). Graphs below show the relative protein level (signal intensity) quantified from three separate immunoblots. * p<0.05. |
|
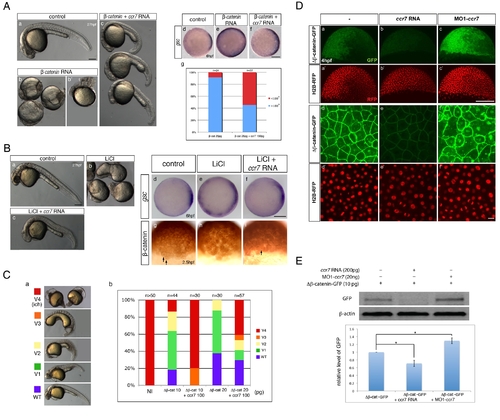
Ccr7 inhibits β-catenin activity via a Gsk3β-indepenedent mechanism. (A) Hyper-dorsalized phenotypes caused by β-catenin overexpression (b,b2, 25 pg, n = 22/25), compared to control WT embryos (a), were suppressed by Ccr7 overexpression (c; 150 pg, n = 8/12). (d–f) Expansion of gsc expression domain in β-catenin overexpressing embryos (e), relative to control WT embryos (d), was suppressed by co-injection of ccr7 RNA (f). Animal views, dorsal to the right. (g) Frequency of embryos with gsc expression domain encompassing more (>180°) or less (<180°) than half of the embryo equator. (B) (a–c) LiCl-treated embryos (b; n = 16/20) show dorsalized phenotypes at 30 hpf compared to control embryos (a). LiCl-dependent dorsalization was suppressed by injection of ccr7 RNA (c; n = 8/20, two experiments). (d–f) gsc expression at shield stage (6 hpf) in control (d), LiCl-treated (e; n = 13/14), and LiCl-treated and ccr7 RNA-injected embryos (f; n = 9/12). Animal views, dorsal to the right. (g–i) β-catenin immunostaining at 256-cell stage in control (g), LiCl-treated (h, n = 9/10), and LiCl-treated embryos overexpressing Ccr7 (i; n = 9/11). Arrows point to a few β-catenin-positive nuclei in control embryos (g) and LiCl-treated embryos overexpressing Ccr7 (i). (C) Ccr7 antagonizes the ability of ΔNβ-catenin to rescue the ventralized ich mutant phenotype. (a) V1–V4 phenotypic classes, with V4 corresponding to the strongest ich phenotype. (b) Frequencies of the V1–V4 phenotypic classes of ich mutants injected with synthetic ΔNβ-catenin RNA alone or co-injected with ccr7 RNA. Injected amounts of RNAs in pg are shown below the graph, and the number of embryos in each group above each bar. (D) (a–c) Co-injections of ΔNβ-catenin-gfp RNA and MO1-ccr7 or ccr7 RNA showed that Ccr7 can downregulate β-catenin, shown at higher-magnification (d–f). Compared to control (a, d), ccr7 RNA overexpressing blastulae showed strongly decreased (b, e), while MO1-ccr7 injected blastulae showed increased, ΔNβ-catenin-GFP signal (c, f). H2B-RFP RNA was injected as nuclear background control (a2–c2 and higher magnification in d2–f2). (E) Western blot analysis of co-injection of ΔNβ-catenin-gfp RNA and ccr7 RNA or MO1-ccr7. Quantification of the relative protein level (signal intensity) from three independent immunoblots (bottom panel). * p<0.05. |
|
Ccr7 functions as a GPCR and promotes calcium signaling. |
|
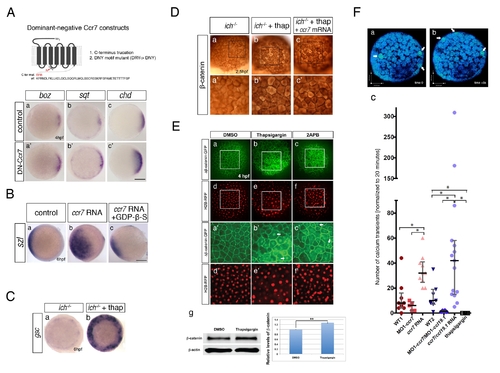
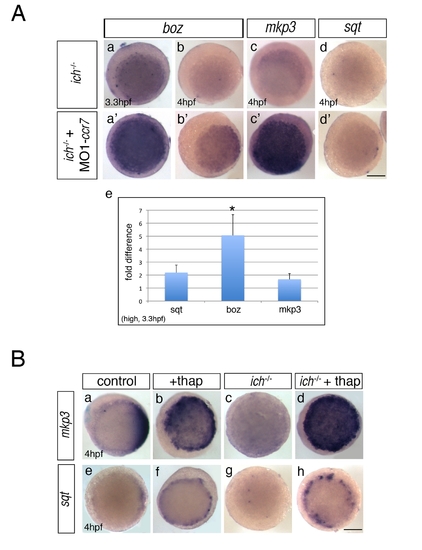
Inhibition of Ccr7 and intracellular calcium promotes expression of dorsal genes. (A) Expression of β-catenin downstream targets, boz, mkp3, and sqt, in ich mutants (a–d) and MO1-ccr7-injected ich mutants (a2–d2) during early blastula stages revealed by WISH. (a–a2) 3.3 hpf, boz, n = 11/14; (b–b2) boz, n = 6/11; and 4 hpf (c–c2) mkp3, n = 8/8; (d–d2) sqt, n = 8/8. Animal views, dorsal to the right. (e) Quantification of the relative expression levels of sqt, boz, and mkp3 in ich mutants and MO1-ccr7-injected ich mutants by qRT-PCR; * p<0.05, Student′s t test. (B) The effect of thapsigargin on the expression of mkp3 and sqt in WT and ich embryos at sphere stage, 4 hpf. (a–d) mkp3: b, n = 9/9; d, n = 13/13. (e–h) sqt: f, n = 6/6; h, n = 8/8. Animal views. |
|
Ccl19.1 chemokine functions as a Ccr7 ligand in axis formation. (A) Injection of ccl19.1 RNA (100–120 pg) resulted in ventralized embryo morphology at 27 hpf (a, a2 n = 30/45; lateral views with anterior to the left) and expansion of szl expression domain (b2) compared to control (b; n = 12/15). Shield stage, animal views with ventral to the left. (B) Ccl19.1 antagonizes the ability of ΔNβ-catenin to rescue the ventralized ich mutant phenotype. (a) V1–V4 phenotypic classes, with V4 corresponding to the strongest ich phenotype (also shown in Figure 3Ca). (b) Frequencies of the V1–V4 phenotypic classes of ich mutant embryos injected with synthetic ΔNβ-catenin RNA alone or co-injected with ccl19.1 RNA. Injected amounts of RNAs in pg are shown below the graph, and the number of embryos in each group, above each bar. (C) (a) The spectrum of dorsalized phenotypes at 27 hpf in embryos injected with 4 ng MO1-ccl19.1 classified into five categories, ranging from C4–C5 (the most severe class) to WT-like. (b) Frequency of each phenotypic category (n = 104, three experiments). (c) WISH analysis of dorsal/ventral markers in ccr19.1 morphants compared to control blastulae. (a2–c3) Expression of dorsal genes was upregulated or expanded: sphere (4 hpf), boz, n = 22/31; mkp3, n = 11/11; shield (6 hpf), gsc, n = 9/10. (d2–e3) Expression domains of ventral genes were reduced: 30% epiboly (4.7 hpf), ved, n = 10/12; shield (6 hpf), szl, n = 11/12. Animal pole views, dorsal to the right. (D) Co-injection of MO1-ccr7 and MO1-ccl19.1 leads to dorsalization in a synergistic fashion. Injection of low doses of MO1-ccr7 (b; n = 24) and MO1-ccl19.1 (c; n = 26) alone did not cause dorsalized phenotypes, as observed for uninjected control embryos (a; 11 hpf, n = 36). (d) Embryos co-injected with the same doses of both MOs resulted in dorsalization (n = 12/23). (e) Frequency of dorsalized embryos in a–d. (E) szl expression was expanded in ccl19.1 RNA-injected (b; 100 pg), compared to uninjected, control embryos (a) and was reduced in MO1-ccr7-injected (c; 12 ng) and ccl19.1 RNA (100 pg) and MO1-ccr7 (12 ng) co-injected embryos (d; two experiments). See text for details. Animal views of shield stage embryos, dorsal to the right. |
|
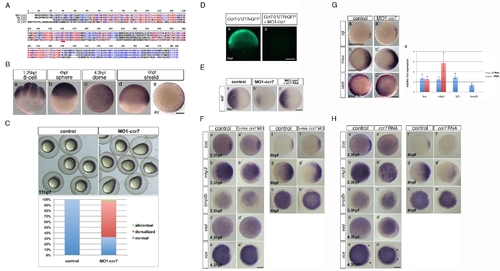
Zebrafish ccr7 gene sequence and expression, MO1-ccr7 efficiency, and specificity tests and expression of region-specific markers in ccr7 morphants. (A) Multiple sequence alignments of selected vertebrate Ccr7 proteins. Mm, Mus musculus; Dr, Danio rerio; Xl, Xenopus laevis; Hs, Homo sapiens. Alignments were carried out using the MultAlin web-based software. (B) Spatiotemporal expression pattern of ccr7 revealed by WISH. ccr7 is expressed maternally (8-cell stage, 1.25 hpf) (a), and its transcripts are uniformly distributed until sphere stage (4 hpf) (b). At dome stage (4.5 hpf), a slight asymmetry in ccr7 expression is observed (c). At shield stage, ccr7 RNA is enriched dorsally (d–e). Lateral views, animal to the top (a, b, d), animal views (c, e). Scale bars in all panels, 200 µm. (C) Embryos injected with MO1-ccr7 (20 ng) exhibited at 11 hpf elongated shape typical of dorsalization; penetrance is shown in the bottom panel. (D) Fluorescent image of zebrafish blastulae at 5.5 hpf injected at 1-cell stage with synthetic RNA encoding ccr7 52UTR-egfp (a) and co-injected with 10 ng of MO1-ccr7 (b). MO1-ccr7 inhibited EGFP expression (n = 24/24) (b). Lateral views. (E) Expression of szl in control (a), MO1-ccr7-injected (c, 10 ng; szl expression reduced in 69%, n = 35), and MO1-ccr7 and ccr7 RNA (100 pg) co-injected embryos (c, szl expression reduced in 26%, n = 50). (F) Expression of dorsal and ventral markers in control uninjected embryos (a–h) and embryos injected with five base mis-matched control morpholino for ccr7 (5-mm ccr7 MO, 20 ng) (a2–h2) revealed by WISH: a, n = 20/20; a2, n = 22/22; b, n = 15/21; b2, n = 14/21; c, n = 22/22; c2, n = 21/21; d, n = 20/20; d2, n = 15/15; e, n = 18/18; e2, n = 17/17; f, n = 19/19; f2, n = 18/18; g, n = 19/19; g2, n = 16/16; h, n = 19/19; h2, n = 16/16. Animal views with dorsal to the right, when the dorsal side is recognizable. (G) Expression of dorsal and ventral markers in control uninjected embryos (a, b, c) and ccr7 morphants (a2, c2, d2) revealed by WISH. Note expanded expression of sqt at 4 hpf (a, a2, 83%, n = 12); hhex at 6 hpf (b, b2, 80%, n = 20), and reduced expression of vent a 4.7 hpf (c, c2, 71%, n = 14). Animal views with dorsal to the right. (d) Quantification of the relative expression levels of boz, mkp3, fgf3, and bmp2b at 3.3 and 4 hpf. See text for details. * p<0.05 (Student′s t-test). (H) Expression of dorsal and ventral markers in control uninjected embryos (a–h) and embryos injected with ccr7 RNA (200 pg) (a2–h2) revealed by WISH: a, n = 20/20; a2, n = 10/16; b, n = 15/21; b2, n = 12/15; c, n = 22/22; c2, n = 10/14; d, n = 20/20; d2, n = 10/15; e, n = 18/18; e2, n = 12/15; f, n = 19/19; f2, n = 9/13; g, n = 19/19; g2, n = 9/13; h, n = 19/19; h2, n = 9/12. Animal views with dorsal to the right, when the dorsal side is recognizable. Arrowheads mark the expansion of ventral expression domain of vox (e and e2). |
|
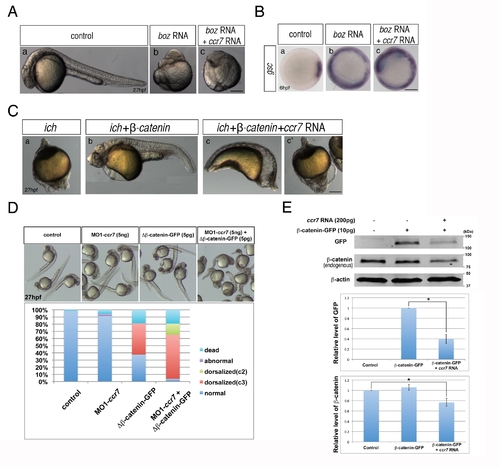
Ccr7 acts upstream of Boz and proximally to β-catenin. (A) The dorsalized phenotypes caused by Boz overexpression (50 pg; n = 15/15) (b) compared to control embryos (a), could not be suppressed by Ccr7 overexpression (150 pg; n = 16/16) (c). Lateral views of embryos at 30 hpf. (B) The expansion of gsc expression induced by injection of boz RNA (b, 50 pg; n = 20/20), compared to control (a), remained unchanged in embryos co-injected with ccr7 RNA (c, 150 pg, n = 18/18). (C) Penetrance of the strongly ventralized ich mutant phenotype (a; 100%, n = 25) was reduced by injection of synthetic RNA encoding β-catenin (b; 50 pg, 6%, n = 15). This rescue was inhibited by co-injection of ccr7 RNA (c, c2, 150 pg, strongly ventralized phenotype 81%, n = 21). Lateral views at 27 hpf. (D) Co-injection of MO1-ccr7 enhanced the penetrance and expressivity of the dorsalized phenotypes of WT 27 hpf embryos injected with RNA encoding ΔN-β-catenin. (E) Ccr7 gain-of-function decreased both levels of endogenous β-catenin and ectopic β-catenin-GFP. Western blotting of β-catenin and GFP protein from uninjected control, β-catenin-GFP RNA (10 pg) injected, or β-catenin-GFP RNA (10 pg)/ccr7 RNA (200 pg) co-injected embryos at 4 hpf. Graphs below show the relative protein level (signal intensity) quantified from three separate immunoblots. * p<0.05. |
|
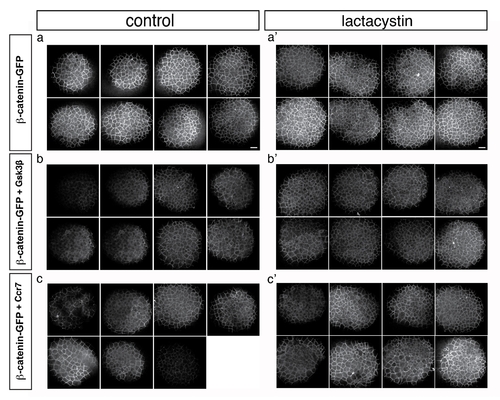
Effect of Lactacystin on Gsk3β and Ccr7-dependent β-catenin downregulation. Confocal microscope images of 4 hpf stage embryos injected with β-catenin-GFP RNA (10 pg) (a–c2) that were injected with RNA encoding Gsk3β (200 pg) (b, b2) or Ccr7 (200 pg) (c, c2) and treated with Lactacystin (a2, b2, c2). Animal views. |
|
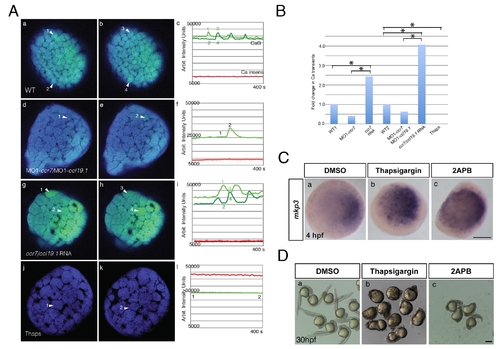
Effects of ccr7 and thapsigargin on Ca2+ transients in superficial blastomeres. (A) Examples of Ca2+ transients at about 256-cell stage in ratiometric images (minimum calcium ratio is 0, maximum is 10). (a) In WT embryo, arrowheads point out increased Ca2+ level at near time points (still images). Note the rapid changes of Ca2+ peaks (compare a to b, which is 35 s later). (c) The average pixel intensity for the Ca2+ sensitive dye, Calcium Green-1 dextran (green) is shown for the cells (numbered arrowheads) and for the Ca2+ insensitive Tetramethyl Rhodamine dextran (red and black) over a 400 s/50 frame time period. (d, e, f) In MO1-ccr7/MO1-ccl19.1-injected embryos, one cell exhibits a Ca2+ transient at 35 s interval. (g, h, i) In ccr7/ccl19.1 RNA-injected embryo, one cell showed Ca2+ transient over 30 s interval. (j, k, l) In thapsigargin-treated embryos no Ca2+ transients were observed over 400 s interval. (B) Number of Ca2+ transients normalized to mean for WT. Injection of MO1-ccr7 and ccr7 RNA were normalized to WT1 group. Injection of MO1-ccr7/MO1-ccl19.1 and ccr7/ccl19.1 RNA were normalized to WT2 group. * p<0.05. (C) mkp3 expression at 4 hpf in WT embryos (a) treated with 4 μM thapsigargin (b) and 50 μM 2-APB (c). (D) Images of control embryos (a) and embryos treated at cleavage stages with thapsigargin (b) or 2APB (c) at 30 hpf. |
|
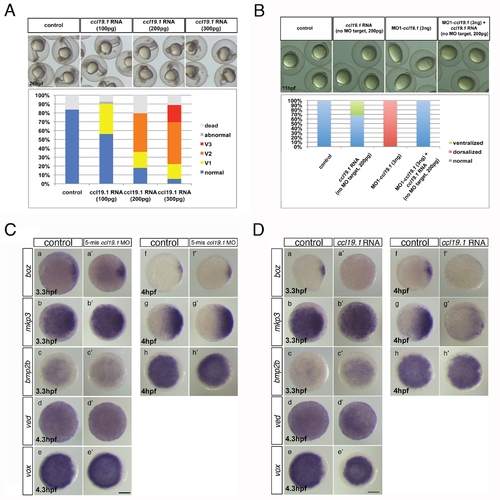
Ccl19.1 overexpression and test of MO1-ccl19.1 specificity. (A) Dose-dependent ventralization of WT embryos injected with ccl19.1 RNA (100–300 pg). V1–V3 classes are defined as in Figure 1B. (B) Ccl19.1 morphants exhibited at 11 hpf dorsalized elongated shape (b), which was suppressed by co-injection of ccl19.1 RNA lacking the MO1-ccl19.1 target site (c, d). (C) Expression of dorsal and ventral markers in control uninjected embryos (a–h) and embryos injected with a five base mis-matched control morpholino for ccl19.1 (5-mm ccl19.1 MO, 4 ng) (a2–h2) revealed by WISH: a, n = 20/20; a2, n = 16/16; b, n = 15/21; b2, n = 9/14; c, n = 22/22; c2, n = 17/17; d, n = 20/20; d2, n = 15/16; e, n = 18/18; e2, n = 19/19; f, n = 19/19; f2, n = 15/15; g, n = 19/19; g2, n = 15/16; h, n = 19/19; h2, n = 15/15. Animal views with dorsal to the right, when the dorsal side is recognizable. (D) Expression of dorsal and ventral markers in control uninjected embryos (a–h) and embryos injected with ccl19.1 RNA (200 pg) (a2–h2) revealed by WISH: a, n = 20/20; a2, n = 10/14; b, n = 15/21; b2, n = 10/14; c, n = 22/22; c2, n = 10/14; d, n = 20/20; d2, n = 9/17; e, n = 18/18; e2, n = 13/17; f, n = 19/19; f2, n = 9/15; g, n = 19/19; g2, n = 12/15; h, n = 19/19; h2, n = 9/14. Animal views with dorsal to the right, when the dorsal side is recognizable. |
|
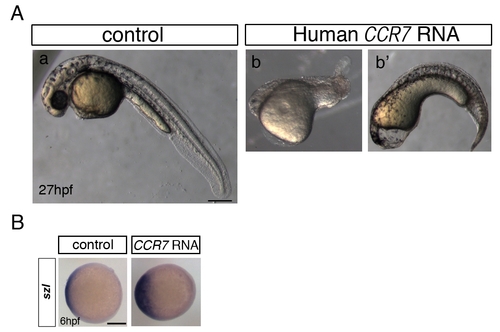
Overexpression of human CCR7 phenocopies ventralization caused by zebrafish Ccr7 gain-of-function. (A) Morphology of control (a) and human CCR7 RNA-injected (200 pg) embryos (b, b2 ventralized phenotype seen in n = 8/25). Lateral views with anterior to the left. (B) Expression of szl in control and human CCR7 overexpressing gastrulae at shield stage, 6 hpf (200 pg, reduced expression seen in n = 10/15). Animal views with dorsal to the right. |

