- Title
-
Mechanism of positioning the cell nucleus in vertebrate photoreceptors
- Authors
- Tsujikawa, M., Omori, Y., Biyanwila, J., and Malicki, J.
- Source
- Full text @ Proc. Natl. Acad. Sci. USA

ZFIN is incorporating published figure images and captions as part of an ongoing project. Figures from some publications have not yet been curated, or are not available for display because of copyright restrictions. |
|
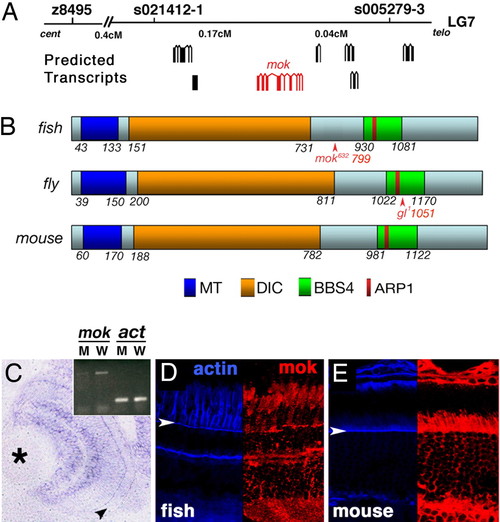
Molecular characterization of the mikre oko (mok) gene. (A) Positional cloning of mok. (B) A schematic diagram of the zebrafish Mok polypeptide in comparison with its Drosophila and mouse homologs. In all three species, Mok polypeptide includes domains thought to bind microtubules (MT), dynein intermediate chain (DIC), actin-related protein 1 (ARP1), and BBS protein 4 (BBS4). In both the zebrafish and the fly, mutant alleles produce C-terminal truncations of the polypeptide (arrowheads). (C) A transverse section through the retina showing mok transcript distribution as evaluated by in situ hybridization. Arrowhead indicates the photoreceptor cell layer, and the asterisk indicates the lens. (Inset) RT-PCR reveals that the mok mRNA level is severely reduced in mokm632 mutant homozygotes, compared with their wild-type siblings. β-actin level (act) is unchanged. (D and E) Mok polypeptide distribution in zebrafish (D) and mouse (E) retinae. (Right) Anti-Mok antibody staining (red). (Left) F-actin distribution (blue). Staining is particularly prominent apical to the outer limiting membrane (arrowheads). In D and E, retinal pigmented epithelium is up. EXPRESSION / LABELING:
|

ZFIN is incorporating published figure images and captions as part of an ongoing project. Figures from some publications have not yet been curated, or are not available for display because of copyright restrictions. EXPRESSION / LABELING:
|
|
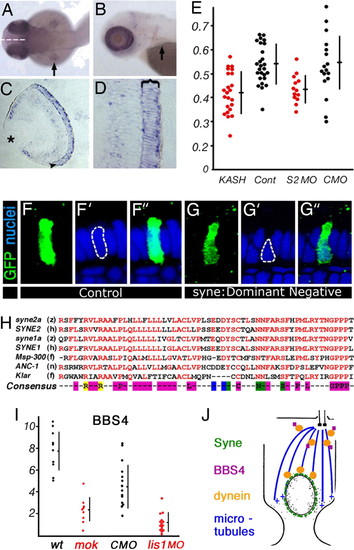
The function of syne2a in nuclear positioning. (A and B) Dorsal (A) and lateral (B) views of PTU-treated zebrafish embryos at 50 and 72 hpf, respectively. Arrows indicate the pectoral fin. syne2a expression is strongly elevated in the eye. (C and D) Transverse sections through the zebrafish retina showing syne2a transcript expression detected by in situ hybridization. The photoreceptor cell layer is indicated with an arrowhead in C and with a bracket in D. (E) The distribution of nuclear positions in cells expressing dominant negative syne2a vector (KASH, red dots) or a control empty vector (Cont, black dots) (left side of the graph) and cells treated with an anti-syne2a morpholino (S2, red dots) or a control morpholino (CMO, black dots) (right side of the graph). The positions of nuclei are calculated as defined in Fig. 1. (F–F3 and G–G3) Examples of data used to plot the distribution of nuclear positions in E in cells overexpressing a control vector (F) or a dominant negative syne2a (G). (F and G) GFP staining of cells in which nuclear positioning was evaluated. (F2 and G2) Nuclear staining (ToPro-3). (F3 and G3) Superimposed images; apical is up. (H) The alignment of KASH domains from two zebrafish syne genes to human sequences, and to sequences of invertebrate genes: Msp-300, ANC-1, and Klarsicht. Conserved residues are in red. The consensus sequence is color-coded as follows: magenta, nonpolar amino acids; blue, acidic; green, polar; yellow, basic. Species designations are as follows: z, zebrafish; h, human; f, fly; n, nematode. (I) The ratio of BBS4-positive particles to the number of cell somata in wild-type and mok photoreceptors (right side of the graph). The ratio of BBS4-positive particles to the number of basal bodies in lis1a morphants, and in control morpholino (CMO)-treated animals (left side of the graph). Each dot represents a separate retina. (J) A model of the mechanism that positions nuclei in vertebrate photoreceptors. The interaction of dynein with Syne polypeptide is hypothetical. EXPRESSION / LABELING:
|

ZFIN is incorporating published figure images and captions as part of an ongoing project. Figures from some publications have not yet been curated, or are not available for display because of copyright restrictions. |
|
Phenocopy and rescue of mok phenotype. Transverse sections through retinae stained with YoPro to visualize cell nuclei (green) and the Zpr-1 antibody to visualize photoreceptors (red) at 4 dpf. In each panel, genotype is indicated in the upper right corner. Captions below indicate reagents that were injected into embryos to test their impact on photoreceptor survival. (A) Morpholino knockdown of mok function in wild-type larvae produces photoreceptor loss. (B) A control morpholino does not affect the photoreceptor cell layer. (C) GFP transcript does not affect photoreceptor survival in mokm632 mutant embryos. (D) The injection of mok transcript into homozygous mokm632 mutant embryos dramatically improves photoreceptor survival. Asterisks indicate the lens. PHENOTYPE:
|
|
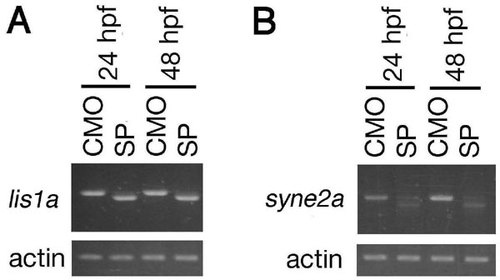
RT-PCR analysis of knockdown efficiency for splice-site targeted morpholinos. (A) A morpholino knockdown reduces the expression of the lis1a wild-type transcript to a nearly undetectable level at 24 and 48 hpf. Sequencing of the lis1a mRNA from SP morphants reveals a deletion of 29 bp followed by a frameshift. This defect eliminates the entire lis1a coding sequence with the exception of the first methionine. It is most likely caused by an activation of a cryptic donor splice site. (B) A knockdown reduces the expression of the syne2a wild-type transcript to a nearly undetectable level at 24 and 48 hpf. Sequencing of the shortened syne2a mRNA present at a low level in morphants reveals a deletion of 52 bp, followed by a frameshift. This lesion eliminates 184 C-terminal amino acids, including the KASH domain from the Syne2a sequence. The predicted truncated polypeptide lacks the transmembrane domain and most likely is not functional. CMO, control morpholino; SP, splice-site targeted morpholino. In all experiments, actin was used as a loading control (lower panels). |

ZFIN is incorporating published figure images and captions as part of an ongoing project. Figures from some publications have not yet been curated, or are not available for display because of copyright restrictions. |
|
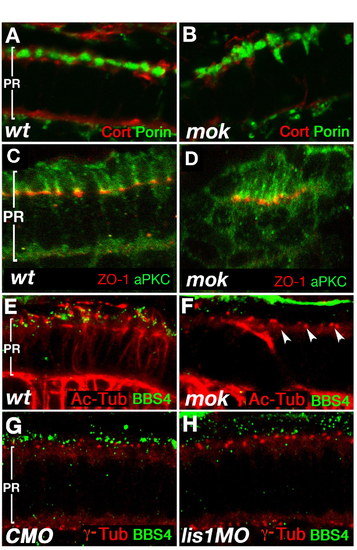
Photoreceptor Polarity and the Subcellular Distribution of the BBS4 Polypeptide. (A and B) Staining for a mitochondrial marker, Porin (green), and Actin-associated polypeptide Cortactin (red) at 3.25 dpf does not reveal obvious differences between wild-type (A) and mutant (B) cells. (C and D) Has/aPKC (green) and ZO-1 (red) polypeptides localize to narrow apical cell surface domains in the area of cell junctions, in wild-type cells (C) as well as in the clusters of elongated mutant photoreceptors (D). (E and F) Staining for BBS4 (green) and acetylated tubulin (red) in zebrafish photoreceptors at 3 dpf. In wild-type (E) but not mutant (F), BBS4 forms aggregates in the vicinity of connecting cilia (arrowheads). (G and H) Staining for BBS4 (green) and basal bodies (red) in zebrafish photoreceptors at 4 dpf. BBS4 staining is strongly reduced in lis1a morphants (H; compare with G). Cilia (E and F) and basal bodies (G and H) are visualized by using anti-acetylated tubulin and anti-g tubulin antibodies, respectively. In all panels, apical is up. EXPRESSION / LABELING:
PHENOTYPE:
|

Unillustrated author statements PHENOTYPE:
|


