- Title
-
Gonadotropin-releasing hormone (gnrh) cells arise from cranial neural crest and adenohypophyseal regions of the neural plate in the zebrafish, Danio rerio
- Authors
- Whitlock, K.E., Wolf, C.D., and Boyce, M.L.
- Source
- Full text @ Dev. Biol.
|
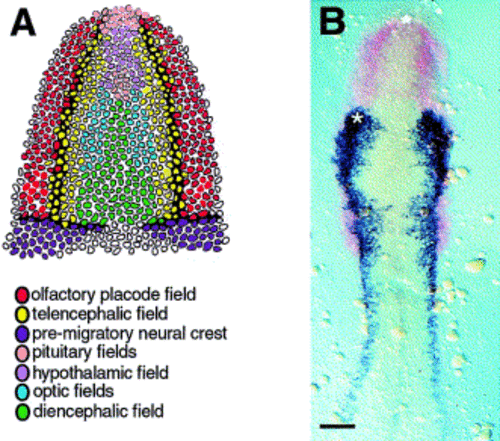
The olfactory placode field abuts the CNC and anterior pituitary fields. (A) Summary fate map incorporating olfactory placode, telencephalic field and edge of CNC (Whitlock and Westerfield, 2000), and eye/diencephalic field (Varga et al., 1999) from zebrafish. Pituitary and hypothalamic domains are based on chick fate map (Couly and Le Douarin 1987 and Le Douarin and Kalcheim 1999). (B) Double in situ hybridization for dlx3 (Akimenko et al., 1994) (red) in olfactory field and fkh6 (Odenthal and Nusslein-Volhard, 1998) (blue) in premigratory CNC. The expression of dlx3 marks the developing olfactory field and otic placode field. There is a row of cells expressing dlx3 that runs along the fkh6 domain. Asterisk marks area where Dil was applied in the living embryo; the star marks the adenohypophyseal region. Scale bar in (B), 100 μm |
|
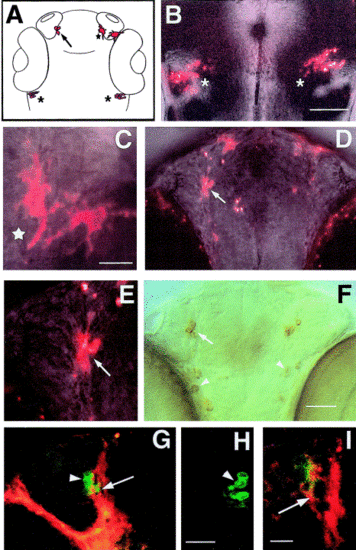
Dil labeling of premigratory cranial neural crest in the living zebrafish embryo. (A) Diagram of 56 h zebrafish head with labeled cells shown in (B–E) colored red: pigment cells (asterisk), cells in trigeminal (star), and cells in terminal nerve (arrow). (B) Dorsal view of 48 h live embryo showing labeled cells in the trigeminal ganglia (asterisks). (A) Ventral view of 56 h live whole-mount embryo head showing two pigment cells (star). (D) Ventral view of 56 h live whole-mount embryo with cells in terminal nerve (arrow). (E) DiI-labeled cells in the terminal nerve (from D) of a live zebrafish embryo (arrow). (F) Anti-GnRH immunoreactivity in TN (arrow) and H population (arrowheads). (G) Ventral view of 56 h whole-mount embryo double labeled for DiI (red) and anti-GnRH antibody (green). DiI is in the GnRH cells of the TN (arrow); some GnRH cells are not double labeled (arrowhead). (H) The contralateral side of this preparation was not labeled for DiI. (I) Higher magnification view of another preparation where the GnRH cells of the TN were double labeled (arrow). Scale bars: (B) 100 μm; (C, E) 25 μm; (D, F) 50 μm; (G, H) 25 μm; (I) 20 μm. |
|
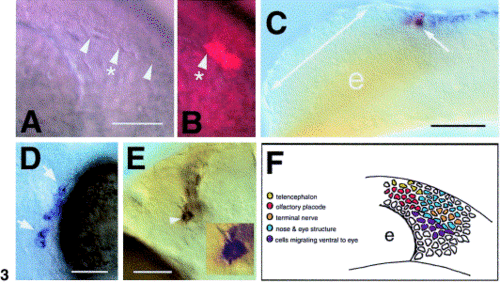
Localization of GnRH progenitors in the cranial neural crest (CNC). (A) Nomarski image of the border (arrowheads) apparent within premigratory crest at 6-7 somites, anterior to the left. (B) Two cells labeled with lineage tracers within the premigratory CNC (arrowhead with asterisk), dorsal to the border. (C) Lateral view of embryo, anterior to the left. Two cells were labeled (arrow, red) within the fkh6 domain (blue). The double-headed arrow indicates the region of the developing olfactory field; e, eye. (D) Ventral view of whole-mount head with clones of cells (arrows) in the eye sclera. (E) Ventral view of whole-mount head showing cells in the TN (arrowhead) positive for GnRH. Inset is of cell indicated by arrowhead. (F) Summary diagram of lineage tracing. Diagram is a lateral view (see A) of the embryo with cells color-coded as to clone types. Each colored cell indicates one of two to three possible cells labeled in each preparation, thus representing the location of the label in the developing embryo. Scale bars: (A, B) 35 μm; (C) 75 μm; (D) 40 μm; (E) 35 μm; inset cell body, 12 μm. |
|
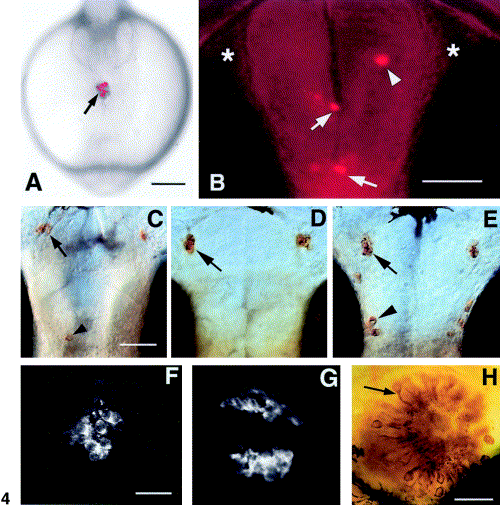
H-GnRH cells develop in association with the anterior pituitary placode. (A) Live embryo at 6-7 somites (∼ 13 h); frontal view showing DiI (arrow) label. (B) Ventral view of a live embryo at 56 h; labeled cells appear in the olfactory bulb (arrowhead), anterior commissure and post optic commissure (arrows). There are no labeled cells in the olfactory organs (asterisks). (C–E) Ventral view of anti-GnRH labeling in whole-mount you-too embryos at 56 h. (A) In mutants animals showing a partial pituitary (F) there are occasional H-GnRH cells (arrowhead); the TN-GnRH cells are present. (D) In animals lacking the pituitary, the H-GnRH cells are missing; the TN-GnRH cells remain unaffected (arrow). (E) TN-GnRH cells (arrow) and H-GnRH cells (arrowhead) are present in the wild-type siblings. (F) Anti-ACTH labeling in homozygous mutants showing a diminished, abnormal pituitary. (G) Anti-ACTH staining in the pituitary showing normal pattern of labeling. (H) Anti-calretinin labeling of the olfactory epithelium showing differentiated neurons (arrow) in the you-too mutant. Scale bars: (A) 200 μm; (B) 50 μm, (C–E) 50 μm; (F–G) 30 μm; (H) 30 μm. |
|
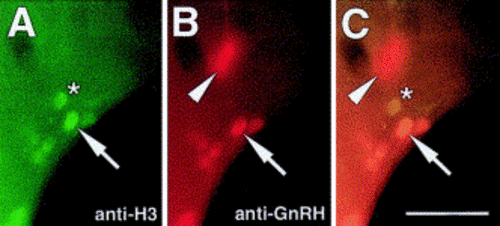
H-GnRH cells undergo cell division after becoming GnRH-positive. (A–C) Ventral view of 56 h embryo processed for both anti-H3 and anti-GnRH antibodies. (A) H-GnRH cells are dividing (arrow) as are non-H-GnRH cells (asterisk). (B) H-GnRH cells (arrow) are positive for anti-GnRH antibody. TN-GnRH cells are evident out of the plane of focus (arrowhead). (C) Colabeling of the H-GnRH cells for the anti-H3 (arrow) and anti-GnRH antibodies. Scale bar: (A–C) 40 μm. |
Reprinted from Developmental Biology, 257(1), Whitlock, K.E., Wolf, C.D., and Boyce, M.L., Gonadotropin-releasing hormone (gnrh) cells arise from cranial neural crest and adenohypophyseal regions of the neural plate in the zebrafish, Danio rerio, 140-152, Copyright (2003) with permission from Elsevier. Full text @ Dev. Biol.

