
Fig. 2
|
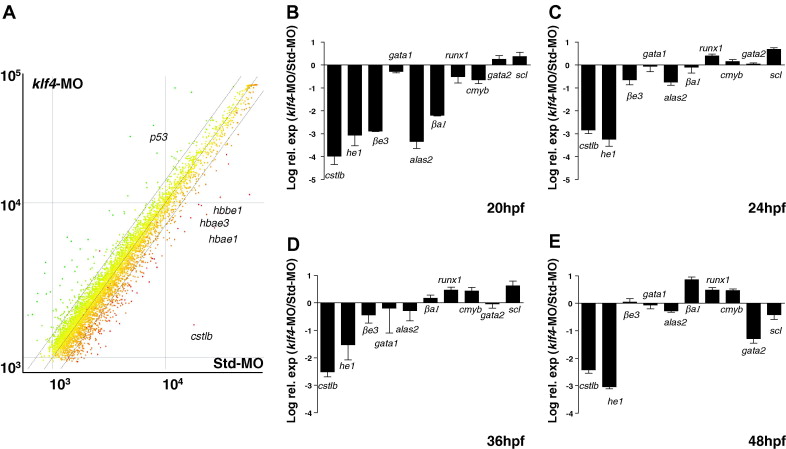
Fig. 2 A global role for klf4 in embryonic erythropoiesis and hatching gland gene expression. (A) Scatter plot of mean relative expression (from four biological replicates) in klf4-MO injected embryos (y-axis) versus Std-MO injected embryos (x-axis). Lines representing 1.4-fold up and down regulation are shown. A few selected differentially expressed genes are indicated. (B–E) Quantitative real time-PCR validation of gene expression for catL, he1, βe3-globin, gata1, alas2, βa1-globin, runx1, c-myb, gata2, and scl at 20 hpf (B), 24 hpf (C), 36 hpf (D) and 48 hpf (E). Values are determined from the delta CT value and expressed relative to expression of γ-actin. Values are means of four experiments and are expressed as log relative expression of klf4-MO divided by Std-MO.
Reprinted from Mechanisms of Development, 124(9-10), Gardiner, M.R., Gongora, M.M., Grimmond, S.M., and Perkins, A.C., A global role for zebrafish klf4 in embryonic erythropoiesis, 762-774, Copyright (2007) with permission from Elsevier. Full text @ Mech. Dev.