
Fig. 10
- ID
- ZDB-FIG-231221-24
- Publication
- Daponte et al., 2023 - Cell differentiation and matrix organization are differentially affected during bone formation in osteogenesis imperfecta zebrafish models with different genetic defects impacting collagen type I structure
- Other Figures
- All Figure Page
- Back to All Figure Page
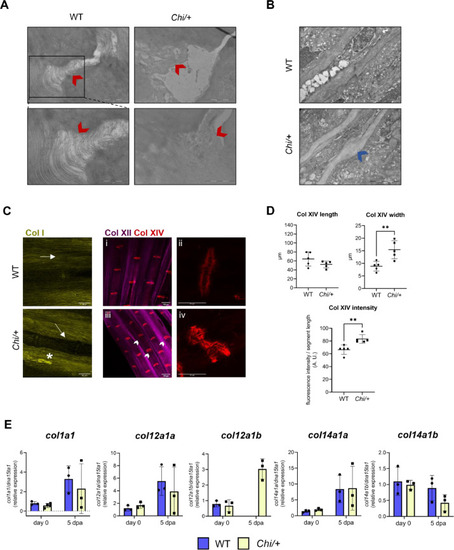
Collagen disorganization in the caudal fin of Chi/+ zebrafish. (A) TEM images of WT (n = 1) and Chi/+ (n = 3) collagen fibrils at the caudal fin joints. In the WT several parallel, well organized collagen fibrils connected the inter-joint surfaces. In the mutant, the joint structure appeared disrupted, with fibrils having different orientations and being scattered in the extracellular space, as indicated by the red arrowheads. Scale bar top: 2 µm. Scale bar bottom: 1 µm. (B) TEM images of WT (n = 2) and Chi/+ (n = 2) caudal fin rays. The presence of calli along Chi/+ fin rays was detected, as indicated by the blue arrowhead. Scale bar: 2 µm. (C) Representative immunofluorescence of collagen I, XII and XIV in WT and Chi/+ caudal fin. Collagen I fibrils were thick and parallel to the fin ray in WT (arrow). In Chi/+ they accumulated in proximity to the fin ray (arrow), in some cases forming aggregates (asterisk). Collagen XII was distributed widely in the caudal fin, similarly to collagen I. Collagen XIV specifically localized in the fin ray joints. In Chi/+, joints showed altered structure and increased inter-joint space, as indicated by the arrowheads (i: collagen XII and collagen XIV co-labeling in WT zebrafish; ii: 63X magnification of collagen XIV-labeled joint in WT zebrafish; iii: collagen XII and collagen XIV co-labeling in Chi/+ zebrafish; iv: 63X magnification of collagen XIV-labeled joint in Chi/+ zebrafish). (D) Collagen XIV analysis revealed increased joint width and fluorescence intensity in Chi/+ respect to WT (n = 5 for each genotype). (E) RT-qPCR analysis of collagens did not show differences between the two genotypes (n = 3 pools of six caudal fins for each genotype). dpa: days post amputation. In the graphs, each dot represents a single value: circle for WT and square for Chi/+. ** P < 0.01. |