|
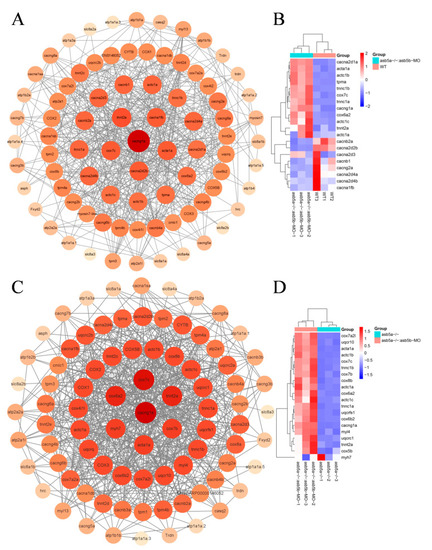
PPI network analysis and heatmap of the top 20 hub genes. (A) PPI regulatory network between the asb5a−/−:asb5b-ATGmo double-knockout and WT groups. All genes were enriched in cardiac contraction entries in KEGG, including 85 nodes and 499 edges. Larger circles and darker colors indicate higher degrees of connectivity. (B) Heatmap of the top 20 hub genes between the asb5a−/−:asb5b-ATGmo double-knockout and WT groups. (C) PPI regulatory network between the asb5a−/−:asb5b-ATGmo double-knockout and asb5a−/− groups. All genes enriched were in cardiac contraction entries in KEGG, including 86 nodes and 576 edges. Larger circles and darker colors indicate higher degrees of connectivity. (D) Heatmap of the top 20 hub genes between the asb5a−/−:asb5b-ATGmo double-knockout and asb5a−/− groups. Rows and columns represent genes and samples, respectively. Red and blue represent high and low expression levels, respectively. Darker colors indicate more pronounced differences.
|