IMAGE

Figure 10

ID
ZDB-IMAGE-231127-73
Source
Figures for Cai et al., 2023
Image
Figure Caption

Figure 10

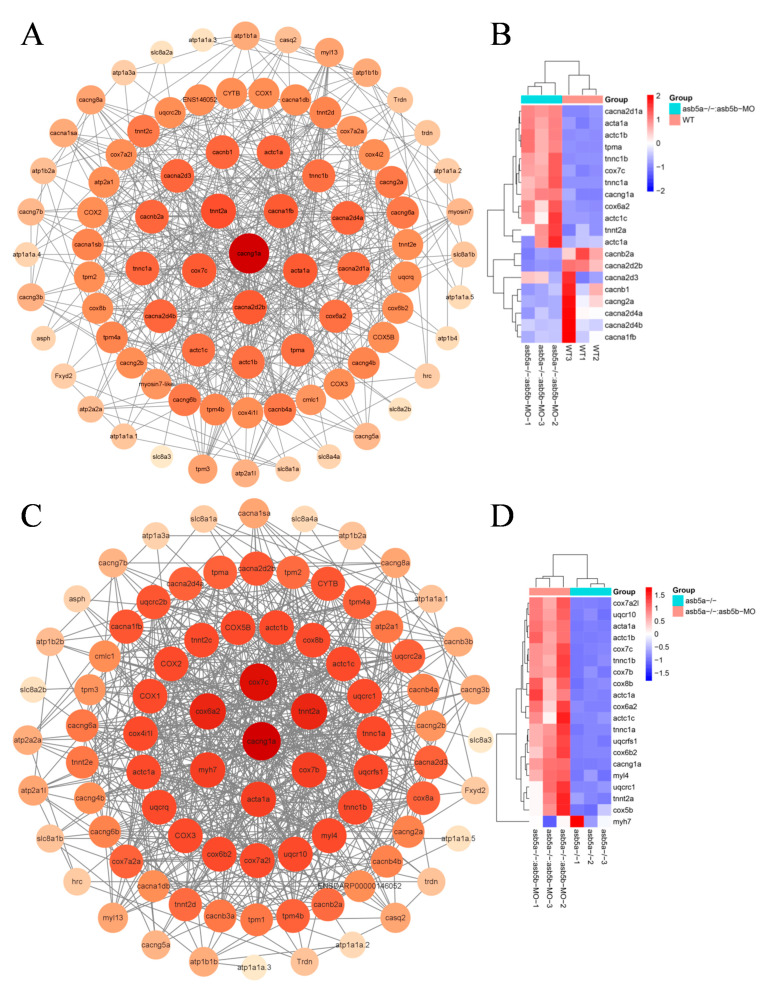
PPI network analysis and heatmap of the top 20 hub genes. (A) PPI regulatory network between the asb5a−/−:asb5b-ATGmo double-knockout and WT groups. All genes were enriched in cardiac contraction entries in KEGG, including 85 nodes and 499 edges. Larger circles and darker colors indicate higher degrees of connectivity. (B) Heatmap of the top 20 hub genes between the asb5a−/−:asb5b-ATGmo double-knockout and WT groups. (C) PPI regulatory network between the asb5a−/−:asb5b-ATGmo double-knockout and asb5a−/− groups. All genes enriched were in cardiac contraction entries in KEGG, including 86 nodes and 576 edges. Larger circles and darker colors indicate higher degrees of connectivity. (D) Heatmap of the top 20 hub genes between the asb5a−/−:asb5b-ATGmo double-knockout and asb5a−/− groups. Rows and columns represent genes and samples, respectively. Red and blue represent high and low expression levels, respectively. Darker colors indicate more pronounced differences.

Acknowledgments
This image is the copyrighted work of the attributed author or publisher, and ZFIN has permission only to display this image to its users. Additional permissions should be obtained from the applicable author or publisher of the image. Full text @ Int. J. Mol. Sci.